With the retreat in oil prices, the Equity Leaders Weekly is going to take a commodity focus this week. Considering this recent weakness, we are going to re-examine the Crude Oil Continuous Contract (CL.F). Rounding out this commodity focus, we will examine and look at the Natural Gas Continuous Contract (NG.F) which is exhibiting some near-term weakness.
Crude Oil Continuous Contract (CL.F)
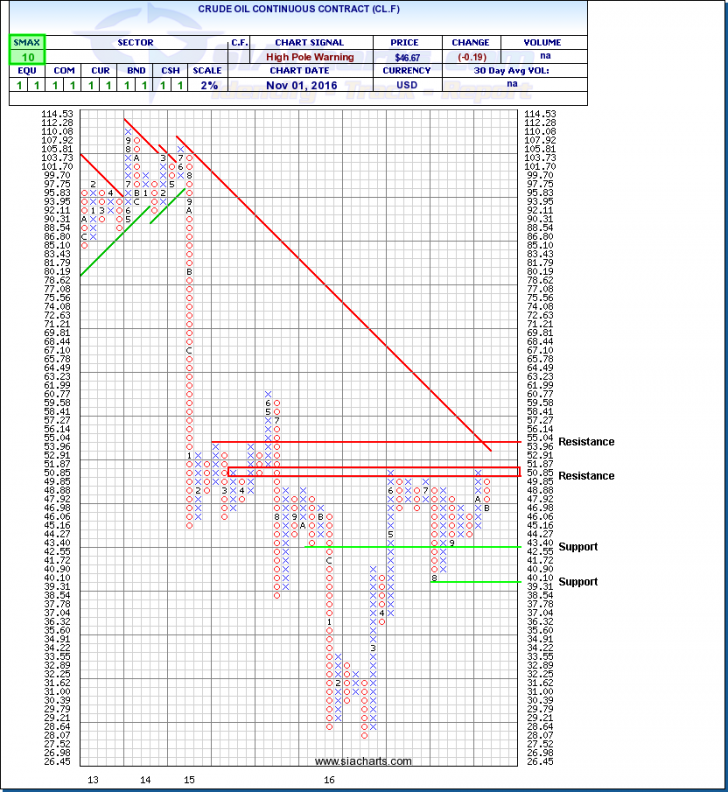
Oil prices continue to weaken after a record jump of 14.4-million barrels in US crude supply announced by the U.S. Government's Energy Information Agency in its weekly report for October 28. Although this number is volatile, there was also a two-million-barrel increase in U.S. imports to 9 million barrels, the highest since 2012. The increase in supply comes after several weeks of draw downs and a sharp drop in inventories. Bottom-line here is the U.S. data shows a world that is still oversupplied with oil. Looking back at our most recent commentary from September 29th, 2016, oil prices are still range bound between the $40 and $50 level, currently residing somewhere in between.
Let's look at the Crude Oil Continuous Contract (CL.F) chart and explore this range a little more. After crossing our previous resistance of $47.92 CL.F turned around and retreated course at our next level of resistance around $50.85 - $51.87. This is the fourth time in 2016 CL.F has approached and subsequently retreated from this level. Our next resistance comes in at $55.04. With prices weakening, we find CL.F approaching the first level of support at $42.55 and just below that again at $39.31. Although a break through the psychological $40 level could signal pressured weakness. This $40 - $50 range appears to be building a strong range bound price action.
Click on Image to Enlarge

Natural Gas Continuous Contract (NG.F)
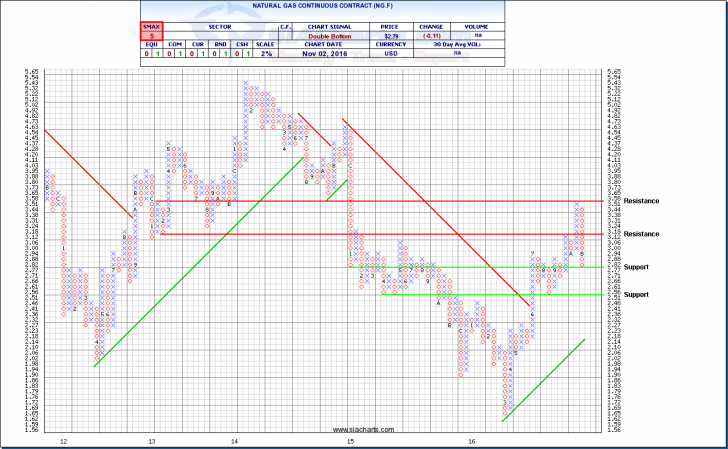
We last looked at natural gas on October 13th, and since then have seen short-term strength turn into weakness. At that time, we questioned whether NG.F would in fact continue to strengthen and reach our first level of resistance at $3.51. After continued strength up to and just over this resistance level, it has pulled back into a column of O's.
Looking at the Natural Gas Continuous Contract (NG.F), we can see that weakness has not only set in but it is also currently sitting right at our current support level of $2.77. The next level of support is found down around $2.51. The continued weakness has also triggered a new level of resistance. Maintaining the level found at $3.58, resistance can now be found at $3.18 as well.
Warmer-than-average weather forecasts in the near weeks have weighed on natural gas prices, since the commodity is used in heating and experiences higher demand in cold temperatures. Could we see this weakness reverse trend and start moving higher in the coming weeks and months with winter around the corner?
With a current SMAX for the NG.F sitting at a 5 out of 10, it is exhibiting some near-term weakness.
Click on Image to Enlarge

SIACharts.com specifically represents that it does not give investment advice or advocate the purchase or sale of any security or investment. None of the information contained in this website or document constitutes an offer to sell or the solicitation of an offer to buy any security or other investment or an offer to provide investment services of any kind. Neither SIACharts.com (FundCharts Inc.) nor its third party content providers shall be liable for any errors, inaccuracies or delays in content, or for any actions taken in reliance thereon.
For a more in-depth analysis on the relative strength of the equity markets, bonds, commodities, currencies, etc. or for more information on SIACharts.com, you can contact our customer support at 1-877-668-1332 or at siateam@siacharts.com.
Copyright © SIA Charts


