by LPL Research
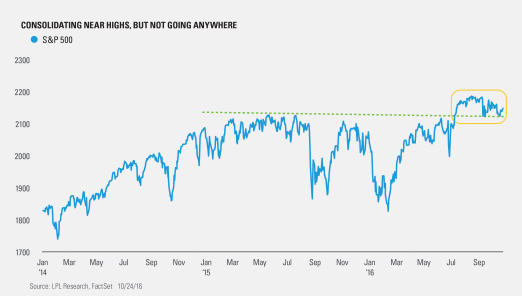
Does anyone want to make a move into equities here? It sure doesn’t seem like it. With the election two weeks away, the S&P 500 continues to stay in a very tight range near all-time highs, as most investors seem content to sit on their hands until the election is over. For more on our thoughts surrounding what might happen after the election, be sure to read our latest Weekly Market Commentary, “Election Playbook.”
Think about this—Since the Wednesday after Brexit, the S&P 500 has closed within three percent of its all-time high every single day. That comes out to nearly four months, or 82 consecutive days. We haven’t seen anything like that since the first half of 1995. At the same time, what makes this streak strange is in 1995, 34 of those 82 days made new all-time highs, versus just 10 new highs during the recent streak.
Here’s another way to look at things. The S&P 500 has now gone 49 straight days without a new high, yet every single day it closed within 3% of the highs. Going back to 1928, this is now the longest steak like this, topping the previous record of 48 straight days in late 1993.
Or as Ryan Detrick, Senior Market Strategist, put it, “What has happened the past four months is truly historic, in that nothing has happened. For equities to trade in this tight of a range near all-time highs is extremely rare and we probably have the election to thank for it, as big money would rather wait until the results before making any moves.”
Historically, October has been the most volatile month, but that has not held at all in 2016. With five trading days to go in October, only one day this entire month has closed up or down 1%. You have to go back 10 years to find the last time October was that tame. Coming into this month, who thought that would happen?
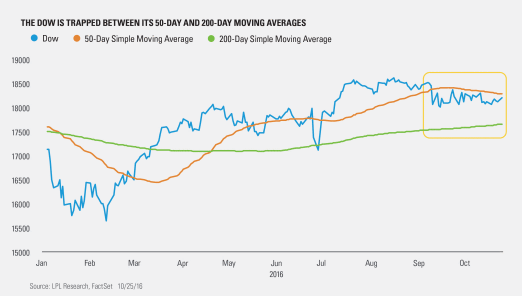
Turning to the Dow, it is also doing something extremely rare. For 32 consecutive days now it has closed above its 200-day moving average, but beneath its 50-day moving average. You have to go back 41 years for the last time we saw something like that. Here’s what makes the recent action strange: The Dow is currently 2.2% away from an all-time high. Back in 1975, the last time this happened, it was more than 20% away from an all-time high.
What could this mean? For starters this is only the 10th time since 1900 the Dow has ever closed 32 straight days between its 50- and 200-day moving averages. There does seem to be some near-term weakness after these streaks eventually end, with the median return three months later on the nine other instances at -0.8% and higher only three out of the nine times. A year out, the median return is 7.1%, more in line with the 7.5% median return since 1900.
Taking a closer look at the 10 times the Dow went 32 days or more between the 50- and 200-day moving averages, the current streak is the closest to the all-time highs, with many of the other instances taking place in bear markets. In other words, it is tough to compare now versus then, as the market is behaving much differently.
This lack of volatility will eventually come to an end and we would expect some higher volatility before the year is over. Of course, the election is the wildcard and should there be any curveballs to either Clinton or Trump’s campaign, a spike in volatility is likely.
Copyright © LPL Research
***
IMPORTANT DISCLOSURES
Past performance is no guarantee of future results.
The economic forecasts set forth in the presentation may not develop as predicted.
The opinions voiced in this material are for general information only and are not intended to provide or be construed as providing specific investment advice or recommendations for any individual security.
Investing in stock includes numerous specific risks including: the fluctuation of dividend, loss of principal and potential illiquidity of the investment in a falling market.
The Dow Jones Industrial Average Index is comprised of U.S.-listed stocks of companies that produce other (non-transportation and nonutility) goods and services. The Dow Jones Industrial Averages are maintained by editors of The Wall Street Journal. While the stock selection process is somewhat subjective, a stock typically is added only if the company has an excellent reputation, demonstrates sustained growth, is of interest to a large number of investors, and accurately represents the market sectors covered by the average. The Dow Jones averages are unique in that they are price weighted; therefore, their component weightings are affected only by changes in the stocks’ prices.
The S&P 500 Index is a capitalization-weighted index of 500 stocks designed to measure performance of the broad domestic economy through changes in the aggregate market value of 500 stocks representing all major industries.
Indices are unmanaged index and cannot be invested into directly. Unmanaged index returns do not reflect fees, expenses, or sales charges. Index performance is not indicative of the performance of any investment.
This research material has been prepared by LPL Financial LLC.
To the extent you are receiving investment advice from a separately registered independent investment advisor, please note that LPL Financial LLC is not an affiliate of and makes no representation with respect to such entity.
Not FDIC/NCUA Insured | Not Bank/Credit Union Guaranteed | May Lose Value | Not Guaranteed by any Government Agency | Not a Bank/Credit Union Deposit
Securities and Advisory services offered through LPL Financial LLC, a Registered Investment Advisor Member FINRA/SIPC
Tracking # 1-548865 (Exp. 10/17)


