by Lance Roberts, Clarity Financial
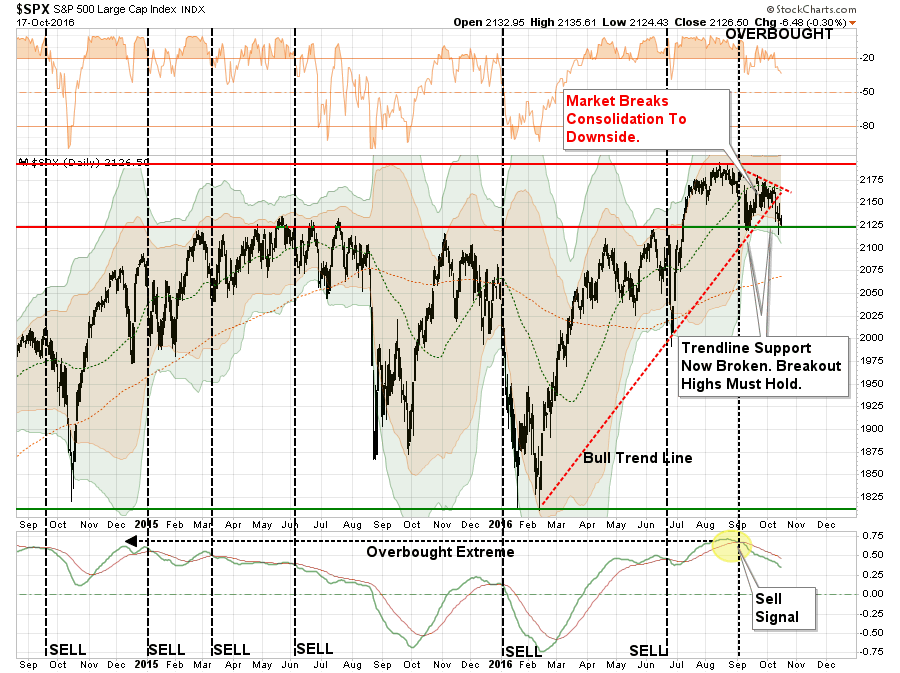
Last Tuesday, I noted that a market decision was coming soon. It came sooner than I anticipated with a sell-off that broke the bullish trend line from the February lows. To wit:
“A major decision point is rapidly approaching which will decide the fate of the market for the rest of the year.”
In the daily price chart below, the break of that bullish trend line is clearly evident.
“Notice in the bottom part of the chart the market currently remains on a sell signal. That sell signal is problematic for two reasons:
1) ‘Sell signals’ combined with overbought conditions tend to lead to at least short-term corrections.
2) ‘Sell signals’ formed at very high levels, such as currently, suggests limited upside and larger correction probabilities.”
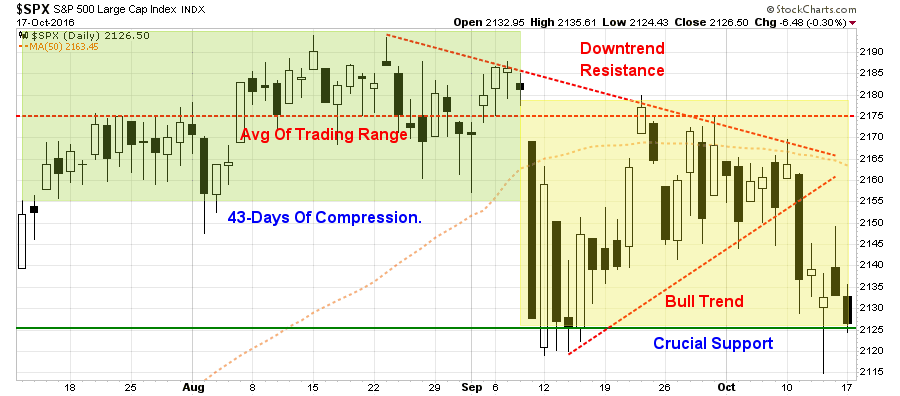
Let’s zoom in on the recent price action in the chart above. The chart below is the last 3-months of daily price movement. As you will see, while prices have been quite volatile, there has been virtually no progress in the market during the period.
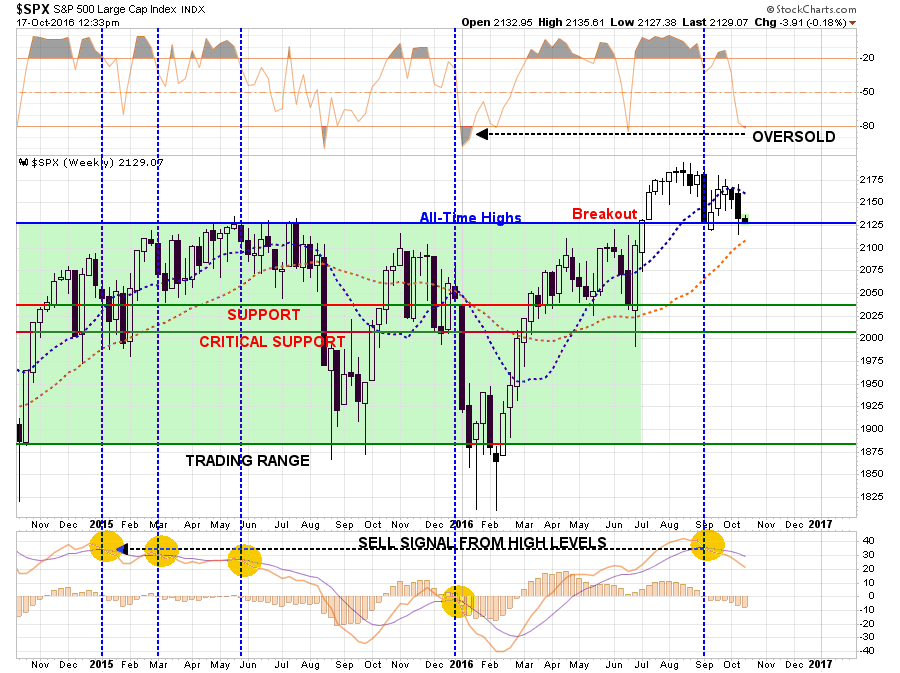
The most critical aspect of the breakdown currently is the very critical support line that is running at 2125 currently. That support line is, as shown in the next chart below, is the breakout of the market from the May 2015 closing highs.
Again, you will notice in the bottom part of the chart, a “sell signal” has been triggered from very high levels. This signal alone suggests the market will have trouble making a significant advance from current levels until this condition is resolved.
Also notice, in the top part of the chart, the market is oversold on a weekly basis currently. However, when that oversold condition existed in conjunction with a “sell signal” previously, there was further downside left in the corrective process.
With that being said, it is critical for the markets to “hang on” to current support at the previous breakout highs. A failure to do so will put the markets back into the previous trading range that has existed going back to 2014.
From a trading perspective, caution remains elevated and portfolios are underweight equities at this point until the current situation is resolved. Obviously, the biggest threat to investors currently remains to the downside if earnings fail to gain traction particularly due to the stronger dollar backdrop as noted in this past weekend’s missive.
Quick Notes On Oil & Rates
Over the last few weeks, I have touched on the rise in both oil prices and interest rates. Both have now reached the extreme upper limits of their potential intermediate term moves, so it is worth updating that analysis.
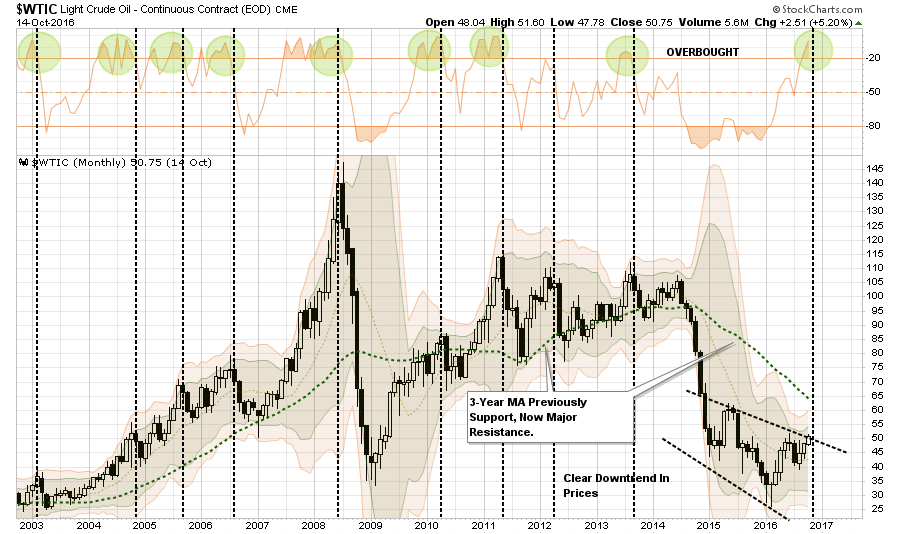
Oil prices recently broke above $50/bbl on a “discussion” by OPEC officials to potentially, maybe, possibly, talk about an agreement to cap oil production in November. Maybe. Possibly.
As I stated initially, the likelihood of such an agreement is slim at best. The reality is there is “no incentive” for these countries to reduce or cap production at a time when revenues are reduced and countries like Saudi Arabia are running a deficit. But what OPEC has figured out is they can raise oil prices with “verbal easing” just like Central Banks have done for asset prices.
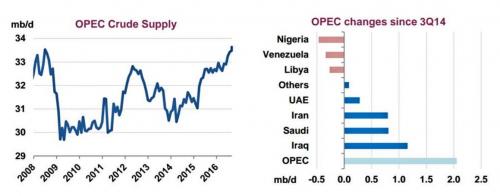
From one OPEC meeting to the next, oil prices have been lifted on promises of production cuts or caps, yet none have actually taken place. In fact, production from OPEC just reached an all-time record in September.
“OPEC increased output by 160,000 barrels a day to a record 33.64 million barrels a day in September, the IEA said, a rather stark departure from last month’s Algiers agreement where most OPEC members agreed to bring output down to a maximum of 33 million barrels a day.”
The increased production shows, among other things, not only just how farcical the recent oil surge has been on the back of expectations that somehow OPEC will actually not only agree on lower production quotas and more importantly comply with them.
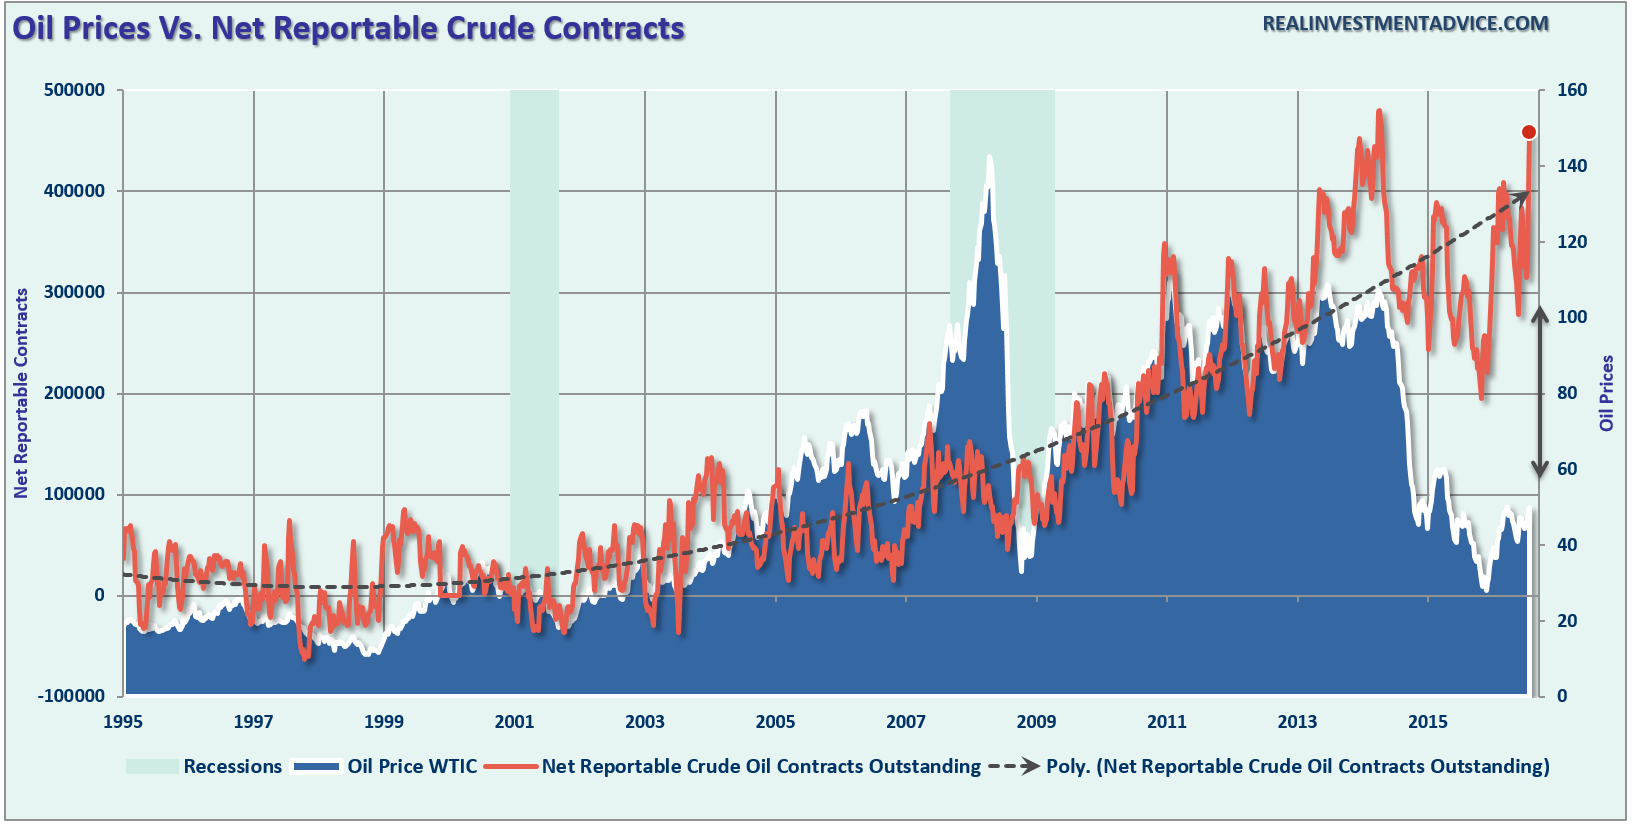
But nonetheless, when looking at the Commitment of Traders report, we find oil longs back near record highs. In fact, as shown below, the last time net longs were this committed to the price of oil was at the peak in 2014.
Furthermore, back to our market commentary, the history of extremely long crude oil contracts and its underlying correlation to the market suggests problems. If oil prices begin to correct, due to a strengthening dollar or further increases in supply, the downside pressure on the markets will increase.
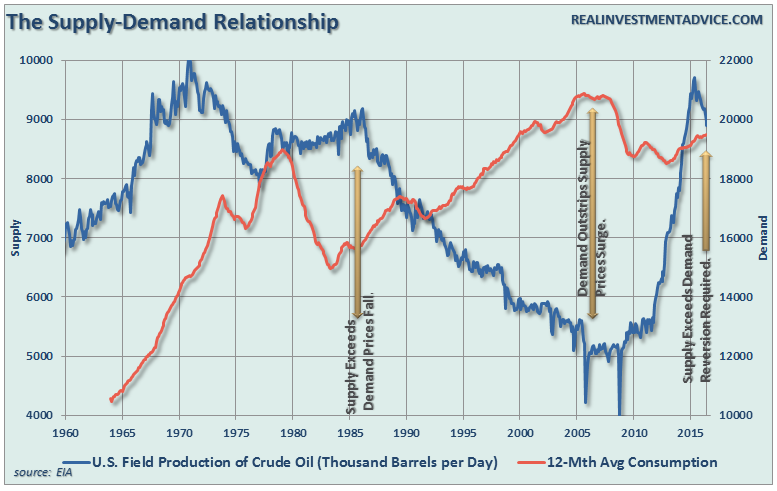
Lastly, despite hopes of a production cap, what is really needed is a massive cut in production to reconcile the largest supply-demand imbalance since the early 1980’s. With global economies weak, more fuel efficient homes, cars and transportation combined with a shift to alternative forms of energy, the re-balancing of supply to demand could take much longer than currently anticipated.
As shown in the first chart above, with oil prices as overbought now as at the last major peak the downside risk to both the commodity and underlying asset prices has risen. The question is whether OPEC can continue to indefinitely pull a “Yellen” out of their hat to “jawbone” prices higher while simultaneously maintaining higher production levels?
I guess we will see.
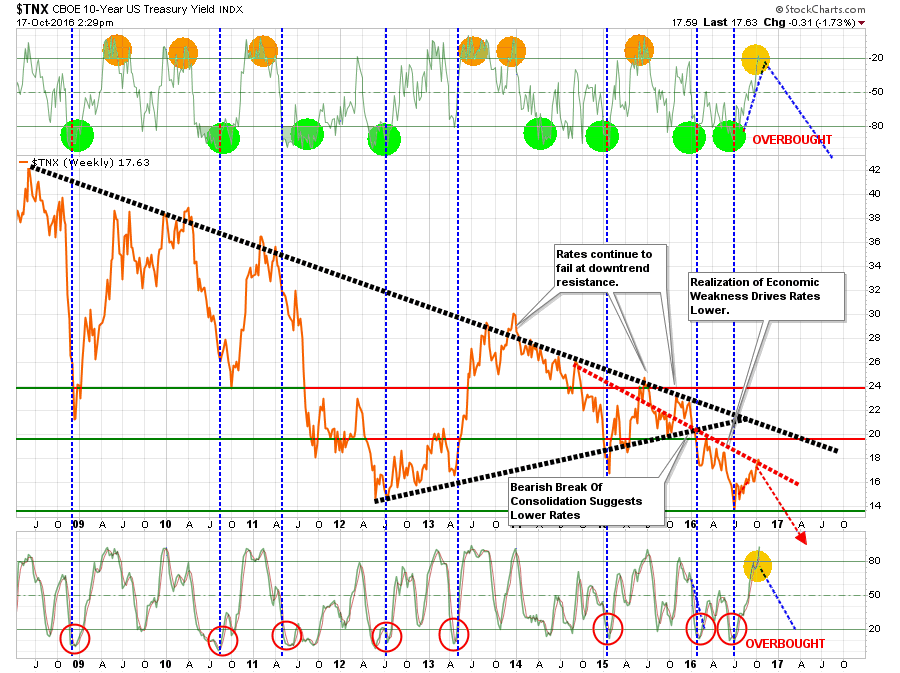
Similarly, interest rates, have also reached a major intermediate-term peak in price movements. With interest rates extremely overbought, the reflexive bounce in rates following the flight to “safety” for the “Brexit” is now functionally complete. This rise in rates is both a blessing and a curse.
For investors, the rise in rates has suppressed bond prices now providing an opportunity increase bond holdings in portfolios. While rates could rise as high as 2%, the reward in bonds now heavily outweighs the risk. There is much angst over the potential rise in interest rates, however, outside of an oversold bounce due to the volatility of the markets, the long-term trend in rates remains lower due to economic growth. As shown in the chart below, there is absolutely NO evidence of economic strength that would suggest a level of sustained higher borrowing costs. 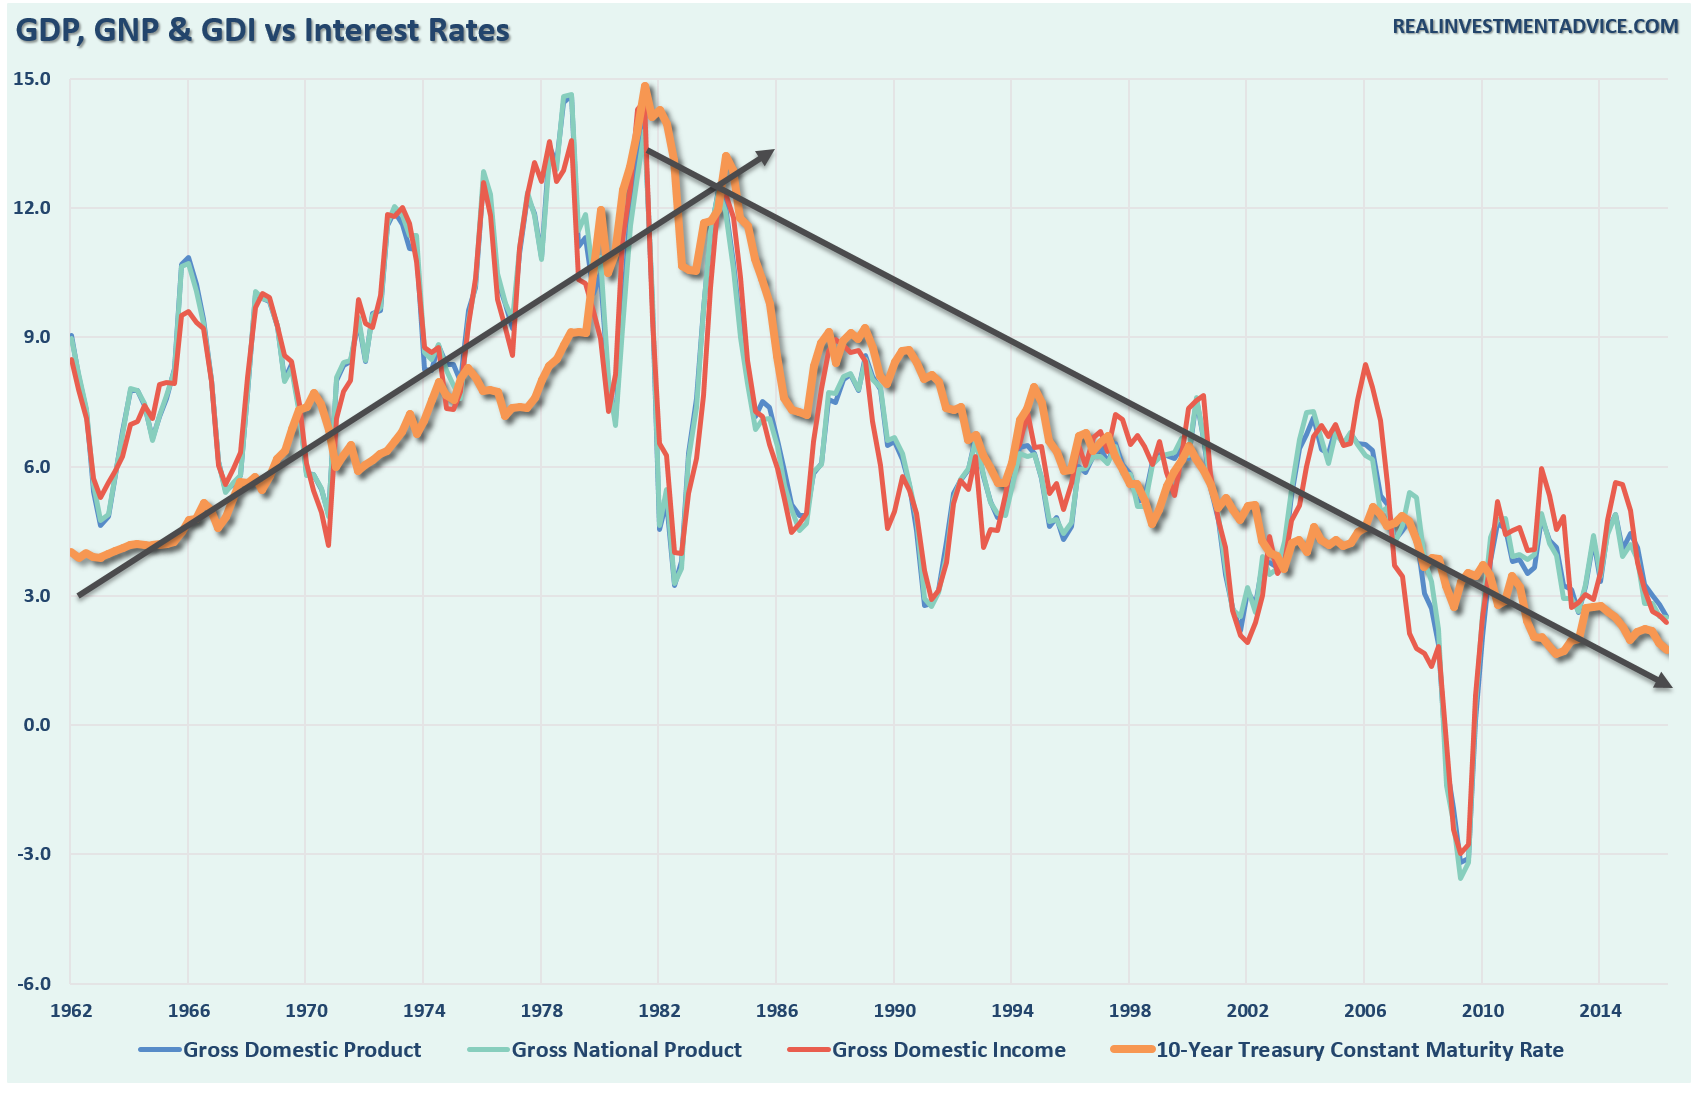
As I have stated previously, interest rates are a function of acceptable borrowing costs in the economy. As economic growth rises, business and individuals can sustain higher borrowing costs as long as revenue and wages are on the rise. However, when rates rise without the ability to absorb higher costs, the negative impact to economic growth comes much quicker.
For the Fed, the biggest problem is the recent rise in interest rates is front running their efforts to lift overnight lending rates. With economic data already weak, the dollar stronger and default risk on the rise, higher rates will slow further economic growth. The Fed may well find itself once again stuck on the sidelines in December unable to raise rates once again due to “economic uncertainty.”
Lance Roberts is a Chief Portfolio Strategist/Economist for Clarity Financial. He is also the host of “The Lance Roberts Show” and Chief Editor of the “Real Investment Advice” website and author of “Real Investment Daily” blog and “Real Investment Report“. Follow Lance on Facebook, Twitter and Linked-In
Copyright © Clarity Financial


