
This week in the Equity Leaders Weekly, we are going to re-examine the British Pound/US Dollar relationship as the GBPUSD has reached new 31 year lows after heightened uncertainty concerning the negotiations with leaving the EU are thought to be raising the likelihood of a "hard Brexit." Secondly, we will look at the Gold Continuous Contract for an update in this important Commodity as it experiences its first pullback in 2016.
British Pound/ United States Dollar (GBPUSD)
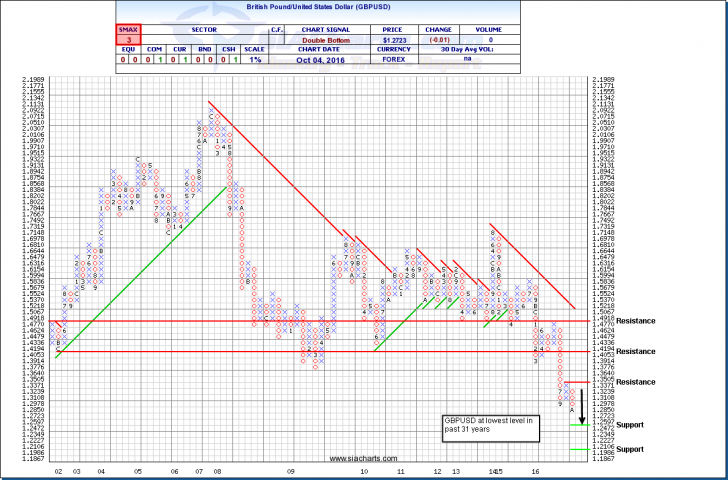
The British Pound against the US Dollar (GBPUSD) is one of the oldest currency pairings in the world and has hit low levels not seen in the last 31 years. After the shock in late June when the United Kingdom voted to leave the EU, this has put tremendous pressure on the Pound leading to several technical breakdowns and the most recent one happening this week amid more uncertainty closing below prior support at 1.285. The point and figure chart shows the last 15 years of this currency relationship which now has support levels found at 1.2472 and around 1.2 coming into play should this weakness continue. Resistance above will stay around the 1.35 level, but could be considered unlikely due to the fact of the increasing likelihood of a US Fed rate hike later in 2016 that the market is expecting which should help the USD over the GBP.
The Pound has remained under broad pressure amid concerns over a “hard Brexit” after British Prime Minister set a March deadline to begin UK’s formal departure process form the European Union. Warnings of continued volatility may become the new normal with the Pound as Britain’s parliament navigates the negotiation process to leave the EU.
Click on Image to Enlarge
Gold Continuous Contract (GC.F)
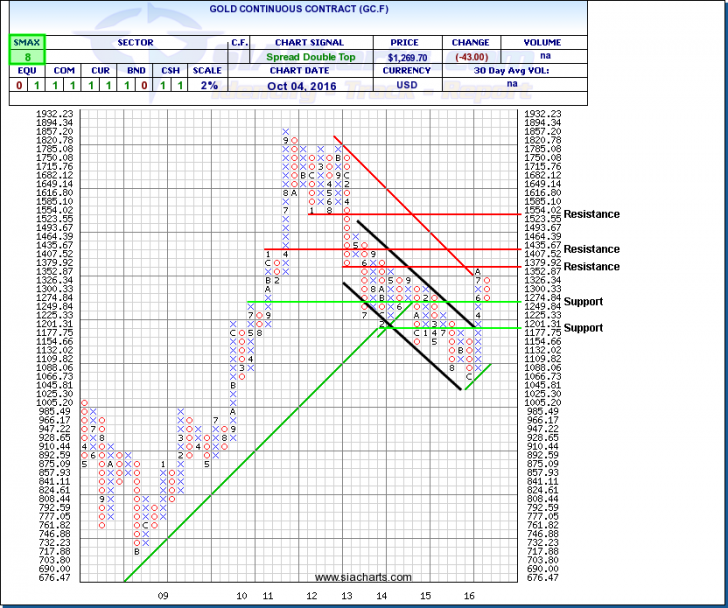
Last week we looked at the relationship of Gold Stocks vs. Gold Bullion, but this week we wanted to also update the important Commodity looking closer at the Gold Continuous Contract (GC.F) chart. Looking at the point and figure chart at a 2% scale (every X or O on the chart represents a 2% move upwards or downwards respectively), GC.F has experienced its first pullback of 2016 reversing back to the support level found at 1249.84. A move through this level could test below 1,200 level around 1,177 as the next level of support. A simple 3-box reversal would not be a signal of a change of trend for Gold unless this weakness continues and resistance to the upside is now found at 1,379.92 and above this at 1,435.
But as with most Commodities, Gold's future price will be affected by other external factors on the horizon. First of all, like we highlighted last week, a small decrease in the price of Gold or a change in trend for this commodity could have a larger impact on Gold stocks since many stocks have appreciated by 2 to 4 times the amount compared to the underlying bullion so volatility could be high for those with Gold equity exposure. Second, uncertainty in the European market with Britain leaving the UK as talked about above could be positive for Gold prices, but a Fed rate hike and/or increased strength in the US Dollar could put pressure on commodity centric countries, their currencies, and as a result, potentially Gold prices. It is unlikely that much will happen ahead of the U.S. Presidential election but when the Federal Reserve meets afterwards they will have to decide if they are to continue with the weaker U.S. Dollar policy by holding rates where they are or raise rates.
For a more in-depth analysis on the relative strength of the equity markets, bonds, commodities, currencies, etc. or for more information on SIACharts.com, you can contact our customer support at 1-877-668-1332 or at siateam@siacharts.com.
Click on Image to Enlarge
SIACharts.com specifically represents that it does not give investment advice or advocate the purchase or sale of any security or investment. None of the information contained in this website or document constitutes an offer to sell or the solicitation of an offer to buy any security or other investment or an offer to provide investment services of any kind. Neither SIACharts.com (FundCharts Inc.) nor its third party content providers shall be liable for any errors, inaccuracies or delays in content, or for any actions taken in reliance thereon.
Copyright © SIACharts.com