


Inside the Numbers: BMO Low Volatility Canadian Equity ETF (ZLB.TO)
Sep 21, 2016
"BMO Low Volatility Canadian Equity ETF has been designed to provide exposure to a low beta weighted portfolio of Canadian stocks. Beta measures the security's sensitivity to market movements. The ETF utilizes a rules based methodology to build a portfolio of less market sensitive stocks from a universe of Canadian large cap stocks. The underlying portfolio is rebalanced in June and reconstituted in December.”
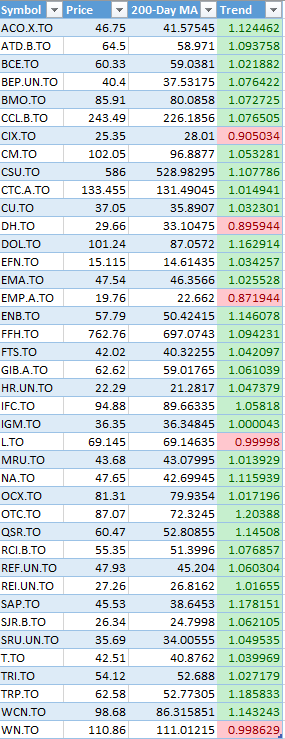
The 40 lowest beta stocks from the 100 largest and most liquid securities in Canada are selected.
Source: http://www.bmo.com/gam/ca/advisor/products/etfs#fundUrl=%2FfundProfile%2FZLB
Let’s look “Inside The Numbers”
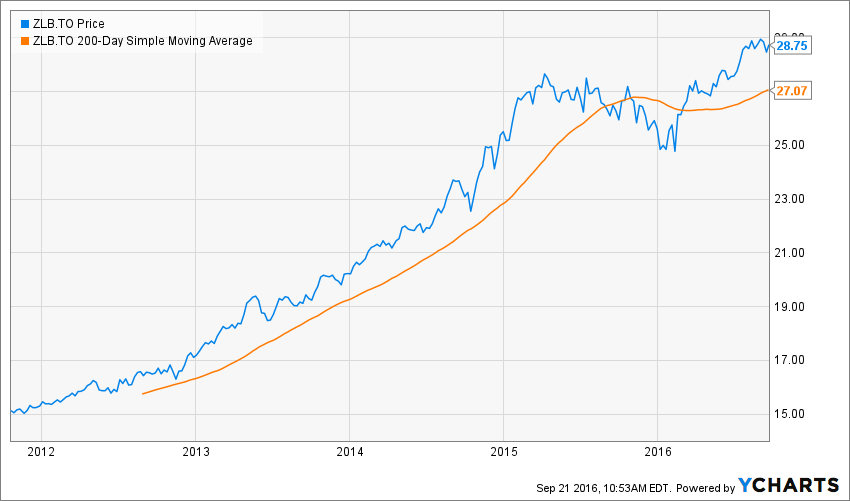

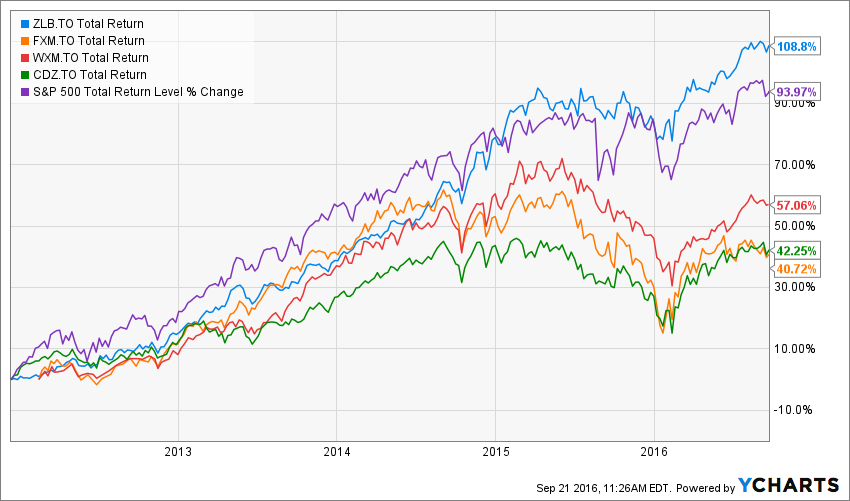
ZLB Total Return Price data by YCharts
Fundamental Chart data by YCharts
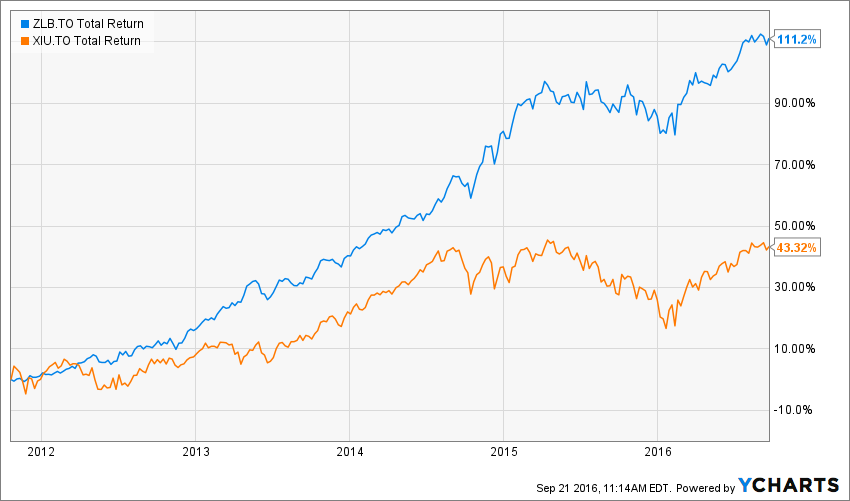
ZLB Total Return Price data by YCharts
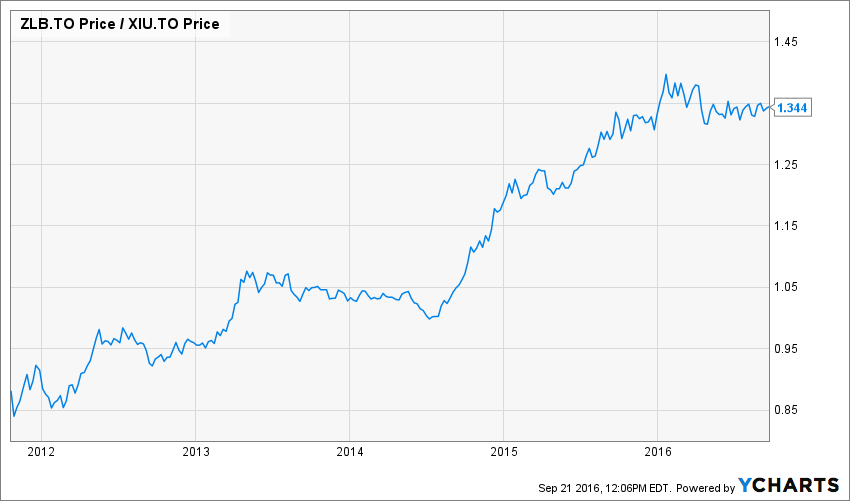
ZLB Total Return Price data by YCharts
The Bottom Line
ZLB has been a great ETF since inception. Its selection methodology is simple and very transparent.
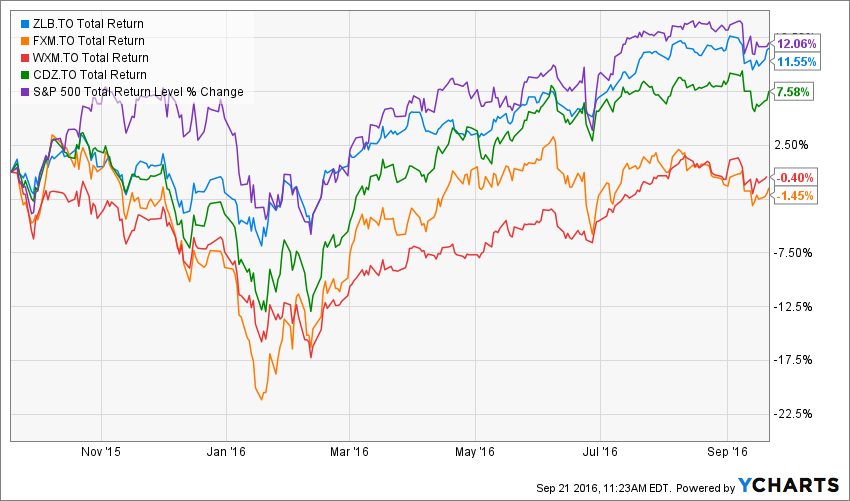
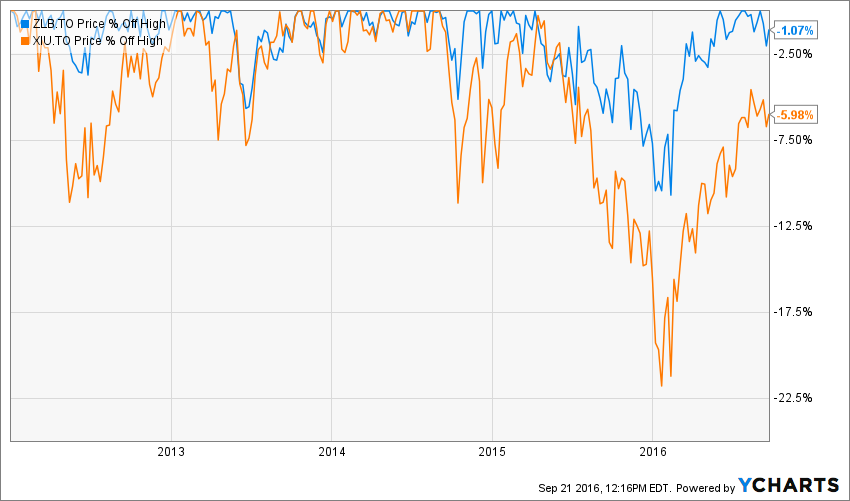
One major concern is the ETF's label - Low Volatility. Low Volatility does not mean low risk. The chart below shows the drawdowns for ZLB and XIU and you can see that ZLB's price held up well when the market dropped over 20% in 2015/early 2016.
Home Depot - Time to Bail or Just a PE Correction?
September 19, 2016
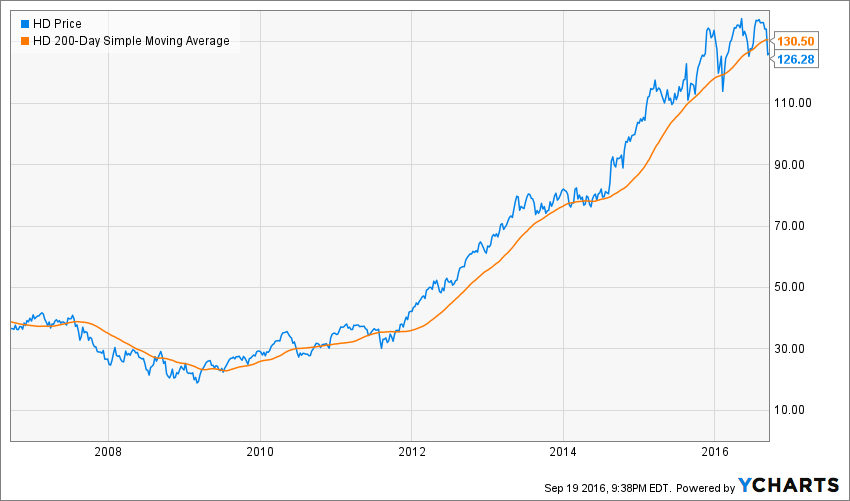
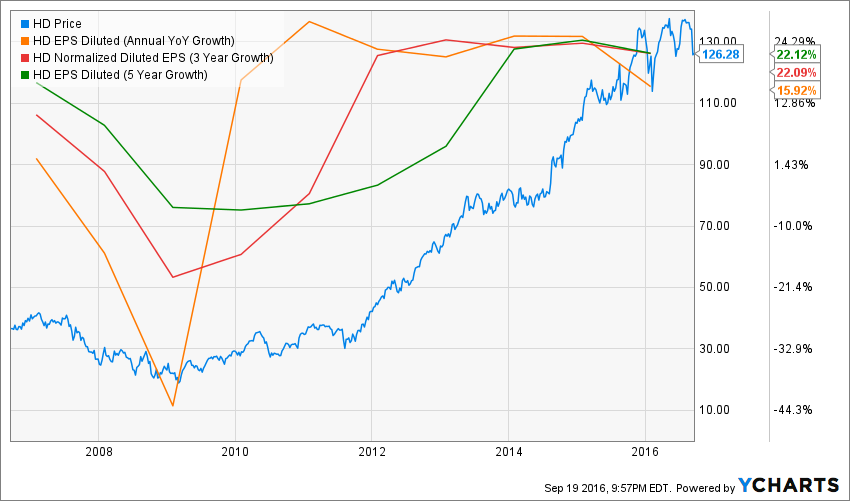
Home Depot has been a great stock to own since the 2008 market correction:

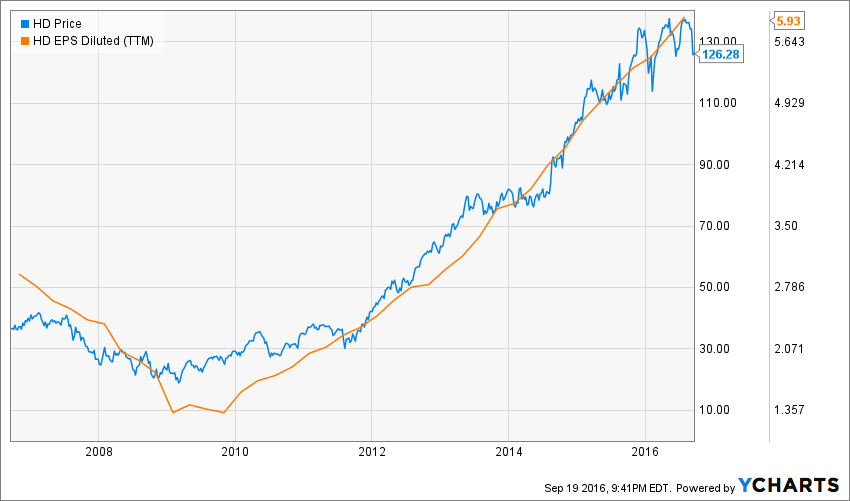
Current EPS TTM is $5.93 and 2017 - 2019 estimates are 6.328, 7.16 and 8.09. Unless the analysts re wrong, HD should perform well through 2019. The current payout ratio is 43% so if HD earns 8.093 they should pay a dividend of $3.48 up from the current $2.56.
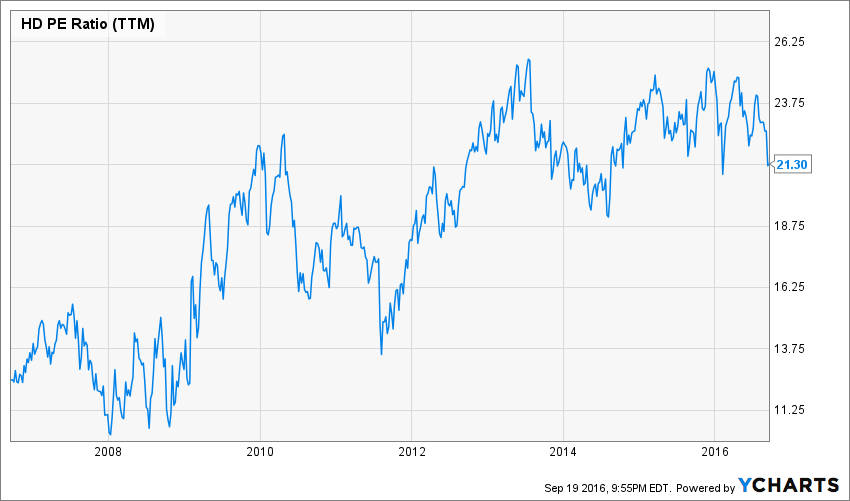
At this stage, the only change is the price earnings multiple. HD's PE hit a brick wall at 25 times earnings and has corrected to 21.3 times earnings.
 HD PE Ratio (TTM) data by YCharts
Is this the beginning of a long-term decline in the price of HD? Until we have further information about earnings, which are expected to be announced in mid-November, price movements will be driven by speculation and volatility in the PE multiple.
This is another example of how you can do a quick "deep-dive" on a stock using YCharts. If you would like a free 7-day trial and 60 minute demo, please give me a call at 905-502-0100.
****
Inside The Numbers is a three times a week equity/ETF feature for portfolio managers or those aspiring to be. Live sessions are held Fridays at Noon Eastern time. During these insightful sessions, a broad range of topics are discussed, ranging from financial markets, investment strategies, business development and how to use stock screening tools, like YCharts.
Synchroncity has been conducting these sessions each week since 2015 and recorded and posted them on their site. To date, they have conducted over 100 sessions with participation from a broad range of advisors across North America.
If you would like to attend live sessions, contact Bob Simpson at 905-502-0100, or via email at info@synchroncity.ca
Copyright © Synchronicity Performance Consultants