by LPL Research
Think about this: Since the post-Brexit vote volatility, the S&P 500 has gone 51 straight days without a 1% drop. We are willing to guess no one (LPL Research included) would have ever expected that. Here are some other stats to show the historic lack of volatility we’ve seen in the past two months:
- During the past 40 days, the S&P 500 has traded in a range of 1.54% (using closing prices), crushing the previous record of 1.96% set in 1963.
- It doesn’t stop there, as the S&P 500 has gone 43 straight days without a 1% close higher or lower. That is the longest streak in two years.
- The usually volatile month of August didn’t see a 1% move up or down in the S&P 500 for the first time in 21 years. Also, August traded in a range of 1.54%, the tightest month in 21 years.
- The S&P 500 has closed within 1% of its all-time high for 44 days in a row, the most since 48 in a row in 1995. That is an amazing persistence to stay near highs.
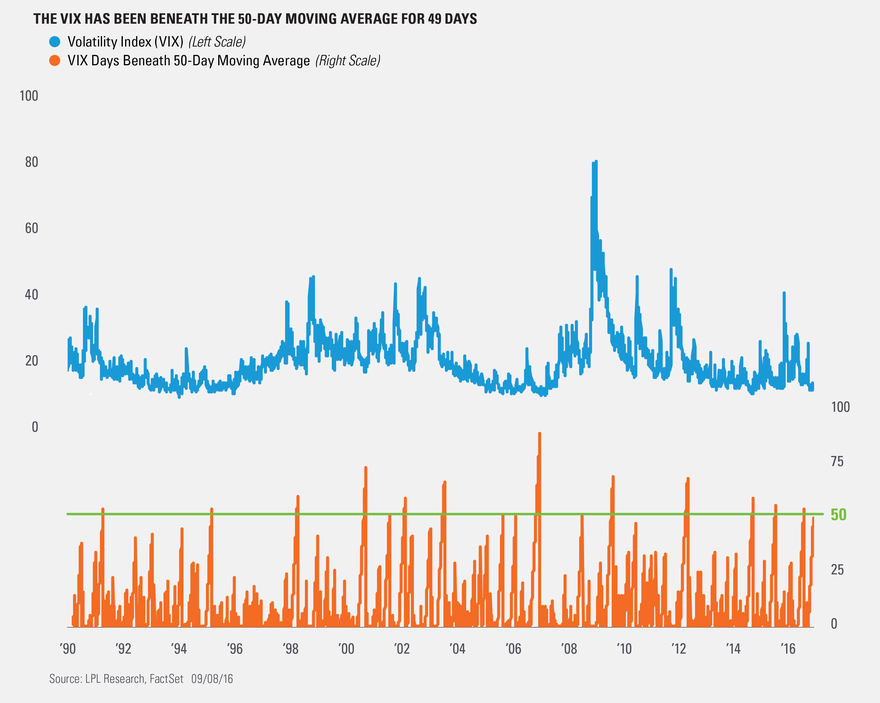
- The Volatility Index (VIX) has been beneath its 50-day moving average for 49 straight days. This is the stat we will take a closer look at today.
With such a lack of volatility recently, it shouldn’t come as a surprise that the VIX has also been low. In fact, it has been beneath its 50-day moving average for 49 straight days and today could make 50 days in a row. As the chart below shows, the VIX has made it to 50 days in a row beneath the 50-day moving average (MA) only a handful of times since 1990.
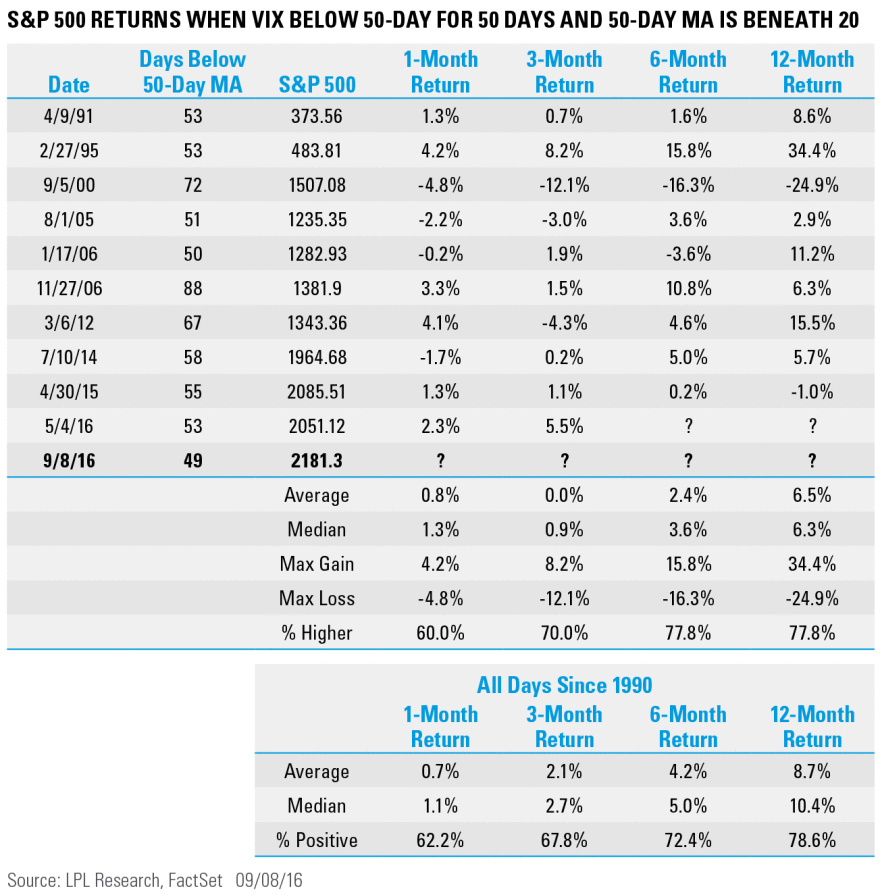
What does it mean? Looking at all the streaks that were 50 days or longer when the 50-day MA was beneath 20 (periods similar to now), the future returns were slightly weaker than the average returns since 1990. Again, these signals triggered after the VIX closed above its 50-day MA—which hasn’t happened yet during this streak.

The past few months have been historic for what hasn’t happened, as the S&P 500 has been caught in the tightest 40-day range in history. This is yet another way to show just how rare things have been.
***
IMPORTANT DISCLOSURES
Past performance is no guarantee of future results. All indexes are unmanaged and cannot be invested into directly. Unmanaged index returns do not reflect fees, expenses, or sales charges. Index performance is not indicative of the performance of any investment.
The economic forecasts set forth in the presentation may not develop as predicted.
The opinions voiced in this material are for general information only and are not intended to provide or be construed as providing specific investment advice or recommendations for any individual security.
Stock investing involves risk including loss of principal.
The S&P 500 Index is a capitalization-weighted index of 500 stocks designed to measure performance of the broad domestic economy through changes in the aggregate market value of 500 stocks representing all major industries.
This research material has been prepared by LPL Financial LLC.
To the extent you are receiving investment advice from a separately registered independent investment advisor, please note that LPL Financial LLC is not an affiliate of and makes no representation with respect to such entity.
Not FDIC/NCUA Insured | Not Bank/Credit Union Guaranteed | May Lose Value | Not Guaranteed by any Government Agency | Not a Bank/Credit Union Deposit
Securities and Advisory services offered through LPL Financial LLC, a Registered Investment Advisor
Member FINRA/SIPC
Tracking #1-533972 (Exp. 09/17)
Copyright © LPL Research


