
by Nathan Faber, Newfound Research
SUMMARY
- We have previously discussed many problems associated with the measurement of alpha.
- Measurement uncertainty, the choice of model risk factors, and the analysis timeframe can all have significant impacts on the calculation and applicability of alpha, and investors are often hard-pressed to obtain sufficient information surrounding the calculation methods.
- These problems can be exacerbated when the techniques to calculate alpha are blindly applied to non-linear strategies.
Many investors mistake noise for alpha. Even those who understand the methods used to calculate alpha and its inherent uncertainty may have a hard time sifting through information that is often provided (e.g. from Morningstar, fund companies, etc.).
We previously covered some of the problems with the measurement of alpha, mainly its dependence on risk factors in the model, the misalignment of short-term performance with long-term expectations, and alpha’s nature as a range estimate rather than a single number.
The Alpha Strategy
If I said I had a stock picking strategy of S&P 500 companies and showed the following regression of monthly excess returns for the strategy (“Alpha Strategy”), what would be your assessment?
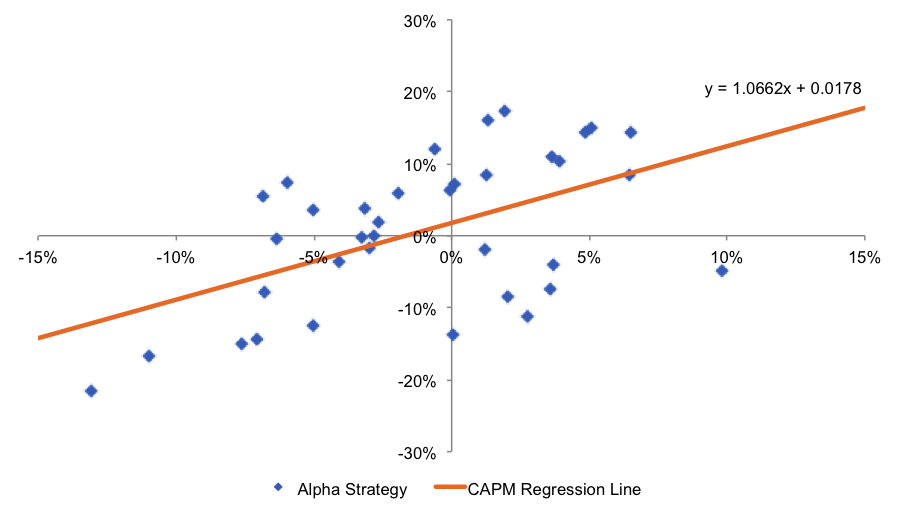
From the regression equation, you can see that the strategy has a beta that is slightly over the market at 1.06, but monthly alpha of 1.78%. That’s the three year track record; what more could you want?
I can send over wire instructions if you would like.
Perhaps a better name for the strategy is the “Pseudo-Alpha Strategy.” The data used to make the strategy is random. It was regenerated until I got some numbers that looked decent.
But all of your excitement could have easily been avoided with more thorough data analysis.
The following graph overlays the 95% confidence interval bounds for the regression line. Its hourglass shape comes from the uncertainty in both alpha and beta.

The 95% confidence interval for alpha is (-1.29%, 4.85%). A true alpha of 4.85% per month would be amazing, but the most important thing to takeaway from this is that the originally reported alpha of 1.78% does not pass the statistical sniff test. If this were a homework assignment, you might say, “We cannot reject the null hypothesis that alpha equals 0%.”
And although we are discussing alpha, this same uncertainty argument applies to beta, which has a 95% confidence interval of (0.48, 1.65). That’s a decent range of market exposure.
But back to our alpha discussion.
Alpha’s Model Dependency
While still examining alpha’s nature as a range rather than simply a single number, let’s add the additional complexity of model dependency.
Suppose you would like to evaluate mutual funds classified as Large-Cap Value by Morningstar. Looking at alpha should be very straightforward, as long as you know the assumptions that went into calculating it.
For instance, if we use a simple CAPM model where the only factor is the S&P 500 excess return, we find that only 31% of the alphas are significant.
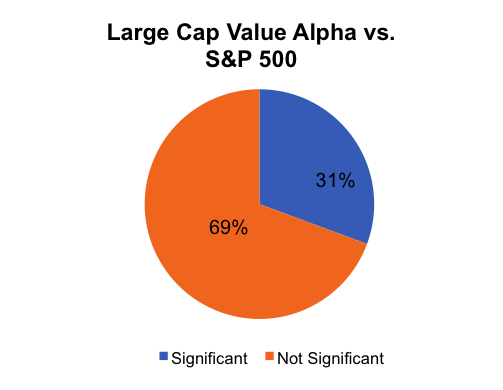
Source: Morningstar. Calculations by Newfound Research.
Since the Russell 1000 is also considered a benchmark for the large-cap equity market, we can do the same analysis and find that now only 29% of the alphas are significant.

Source: Morningstar. Calculations by Newfound Research.
Why? Well, it likely has to do with the higher tilt of the Russell 1000 to mid-cap companies relative to the S&P 500.
But here is where we have to ask ourselves a question. Should these managers be credited for alpha when they are really just doing smart beta (i.e. value)? To account for this, we can use the Russell 1000 Value index as our benchmark. In this model, we find that now only 18% of the alphas are significant.
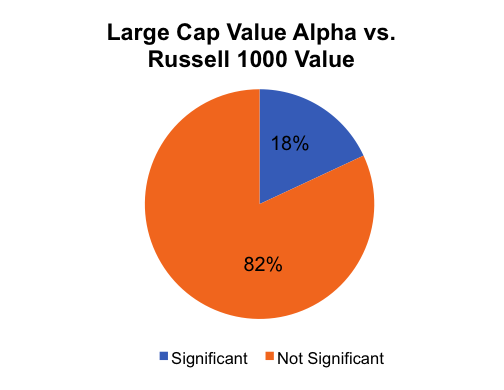
Source: Morningstar. Calculations by Newfound Research.
To cap off the evolution to the Fama-French 3-factor model, we can use the Russell 3000 Value index as the benchmark, thus incorporating the size factor. Now only 13% of the funds have significant alpha.

Source: Morningstar. Calculations by Newfound Research.
Each of these calculations compares all of the funds to a consistent benchmark. If you are looking at data on Morningstar, you will also see a “best-fit alpha,” which is the alpha of the fund relative to the benchmark that has the highest correlation to the fund over the time period. Evaluating the alpha calculated using each fund’s best-fit benchmark, we now find that 20% of funds have significant alpha.
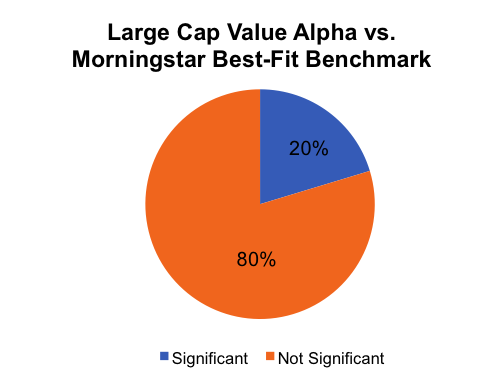
Source: Morningstar. Calculations by Newfound Research.
One pitfall with this approach is that you are now comparing apples to oranges. If the goal is to evaluate the Large-Cap Value funds, holding certain funds to a value benchmark while putting others up against the S&P 500, both of which are listed as best-fit benchmarks, will yield some unfair comparisons.
Directional Alpha
Up to this point, we have only considered alpha’s significance with no regard for its reported value.
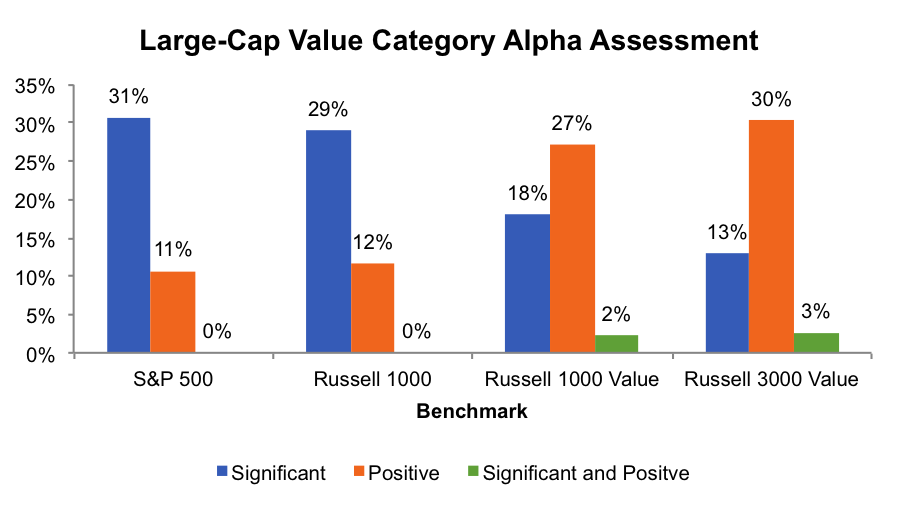
The chart below shows the percentage of significant, positive, and jointly significant and positive alphas relative to each benchmark.
Source: Morningstar. Calculations by Newfound Research.
Not surprisingly, with how value has lagged growth over the past three years, we see that the fewest number of funds have positive and significant alpha when the S&P 500 is used as the benchmark. As the benchmarks become more “appropriate”, that is, accounting for value and size tilts, we see the occurrence of significant alpha decreases. However, we also see that the number of positive (and significant, positive) alphas increases as additional risk factors are accounted for by the regression.
But care must be taken when adding additional risk factors to a model with the goal of isolating and measuring alpha. Including more factors in a regression may make the regression fit the data better, but there is value in simplicity as well.
If you take a set of 36 independent risk factors, you can calculate the alphas for the strategies with no uncertainty. But are all of those 36 risk factors legitimate?
Some uncertainty is necessary for the results to hold water in the future, and making decisions for the future is usually the primary goal of these analyses.
Benchmark for a Tactical Strategy
Now let’s move into the realm of tactical strategies, more specifically, ones that aim to provide downside protection.
These strategies aim for a nonlinear return profile, so as you might expect, applying linear regression techniques to them might yield some suspect statistics.
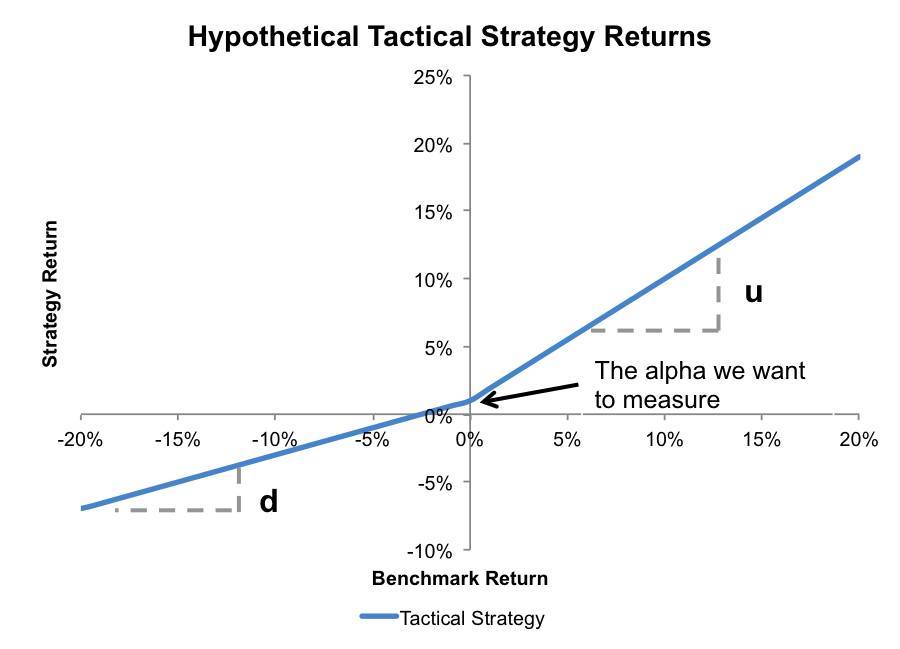
For simplicity, assume we can describe the tactical strategy purely by its upcapture and downcapture ratios, u and d, respectively. These are essentially like two betas, one that applies for positive benchmark returns and one that applies for negative benchmark returns.
The chart below shows the same hypothetical strategy with a regression line superimposed. Notice the difference between the alpha that we want to measure (α) and the alpha that we actually measure (αphantom).
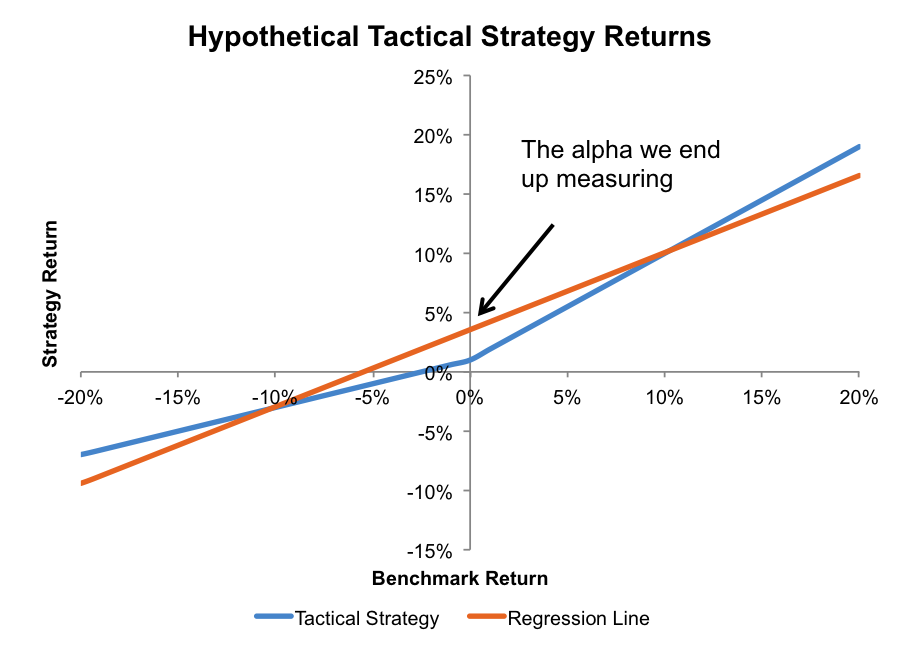
For convex strategies like the one shown (upcapture > downcapture), the alpha measured will always be greater than the alpha we want to measure. For concave strategies, the alpha calculated using linear regression will be lower.
(Side note: concave strategies, i.e. those with a downcapture that is greater than the upcapture, can still be very valuable. We covered why in our post about the asymmetry zone.)
In these types of strategies, we can actually quantify how much difference there will be between our calculated alpha and the “true” alpha with a few assumptions.
First, we will assume that the benchmark returns are all equally likely over the range shown. In other words, the “line” of returns is actually a line.
Secondly, we will assume that the length (L) of the interval of benchmark returns is centered on 0. With these assumptions the alpha we are after has a simple formula based on the upcapture, downcapture, length of the benchmark return interval, and phantom alpha calculated using linear regression (the alpha reported by Morningstar).
![]()
In the above example, the returns ranged from -20% to 20%, so L = 0.4. The upcapture was 0.9 and the downcapture was 0.4. Using the above equation, the phantom alpha over estimates the true alpha by 125 bps. If this is monthly return data, that is a sizable overestimate.
In this model, the beta calculated in the regression is simply the average of the upcapture and downcapture.
Getting More Realistic
The above tactical model presented a highly simplified version of the real world. If we neglect the second assumption and allow the benchmark return interval to move off the zero center point, we can still calculate the difference between alpha and the phantom alpha. However, the equation is not for the faint of heart.
If we neglect the first assumption and allow discrete returns, the result will still approximate the true difference as long as the returns are relatively evenly spaced.
In a real strategy, the upcapture and downcapture are calculated using average returns over periods. They only summarize what the strategy has done. Future returns will not obey the strict formula for the strategy returns we have set out, but considering that the same is true for the CAPM regression with alpha and beta, there is not much difference. If you are going to make a decision based on the results of a model, the model should be as close to reality as possible.
Taking a step back, this analysis calls into question the suitability of alpha as a measure of manager skill for non-linear strategies. If the objective is to limit losses while participating in market gains, the difference between upside and downside capture is perhaps a more useful metric than either the true alpha or the phantom alpha in the model above.
Conclusion
In the investment industry, we commonly have to rely on statistics that are provided by others. If we do not have the underlying data to verify the statistics ourselves, it is helpful to know how they were calculated, the assumptions that come into play, and how to interpret the results. These all apply to assessing alpha:
- Alpha relies on a linear fit. If the strategy is not linear, a correction factor may help.
- The linear model used can have a strong impact on the value of alpha and its uncertainty. If you don’t know how it was calculated, ask. If no uncertainty is given and you can’t calculate it yourself, ask for that, too.
- When looking at reported alphas, just because one alpha is larger than another, either positively or negatively, that does not mean that it is more significant. In the examples with the large-cap value funds, there were a handful of funds that had statistically insignificant alphas that were larger in magnitude than those of funds that were statistically significant.
The most important point to remember is that all models can only describe so much about probabilistic phenomena. Understanding the bounds of applicability can make the models useful and make the risk of acting on bad data less likely.
Client Talking Points
- Performance and risk statistics about different investments can be very useful when the context is properly understood. The importance of context means, however, that comparing the same statistic across investments is not necessarily an apples-to-apples exercise.
- Even though a group of funds is classified in the same way, they can have varying performance based on their specific investment process. Choosing a fund based on its process can lead to a more thorough understanding of past and future results than choosing a fund based on a classification.
- Focusing solely on outperformance as the basis for investment selection can lead to performance chasing without accounting for factors such as luck and the current market environment.
Nathan Faber
Nathan is a Vice President in Newfound’s Investment Strategies group, where he is responsible for the ongoing research and development of quantitative investment models.
Copyright © Newfound Research