
by Jesse Felder, The Felder Report
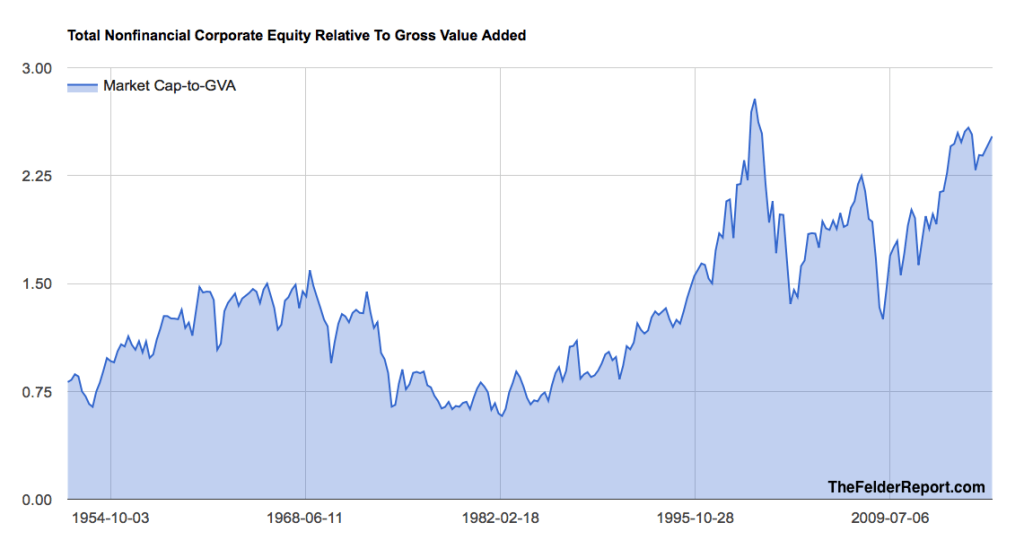
Just over a year ago, Dr. John Hussman introduced a new way to value the broad stock market, total market cap of non financial U.S. corporations relative to their “gross value added.” Essentially, it’s a more efficient version of the Buffett Yardstick which measures the total market cap of the U.S. stock market relative to GDP which is basically a price-to-sales ratio.
Hussman’s version is more efficient because it incorporates foreign revenues earned by domestic corporations. The major criticism of the Buffett yardstick is that it does not. (The greater efficiency of Hussman’s Market Cap to GVA measure is borne out in its greater negative correlation to future returns.) Currently, this measure shows stocks were only more highly valued than they are today back during the height of the dotcom mania.
 One thing that has bothered me about Hussman’s measure, though, is that it doesn’t account for corporate debt levels. From an investment standpoint, I believe it is impossible to accurately value the equity of a company without also measuring the amount of leverage being employed in the business. By extension, the same should be true for the broad equity market, as well.
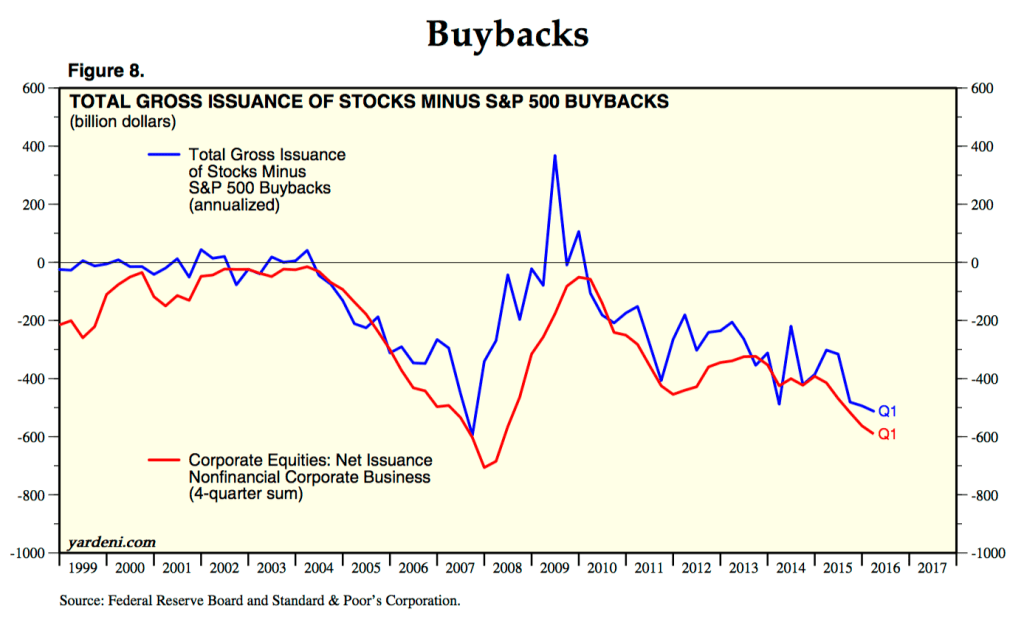
While the market cap of U.S. stocks has soared over the past seven years, companies have increasingly issued new debt in order to buy back stock. In fact, total nonfinancial debt relative to GVA has been hitting new all-time highs for quite some time now. In other words, nonfinancial corporations have never been more highly leveraged than they are today.
This process of swapping debt for equity by borrowing to buyback stock effectively reduces market cap while adding debt to their balance sheets. This is not reflected in the Hussman chart.
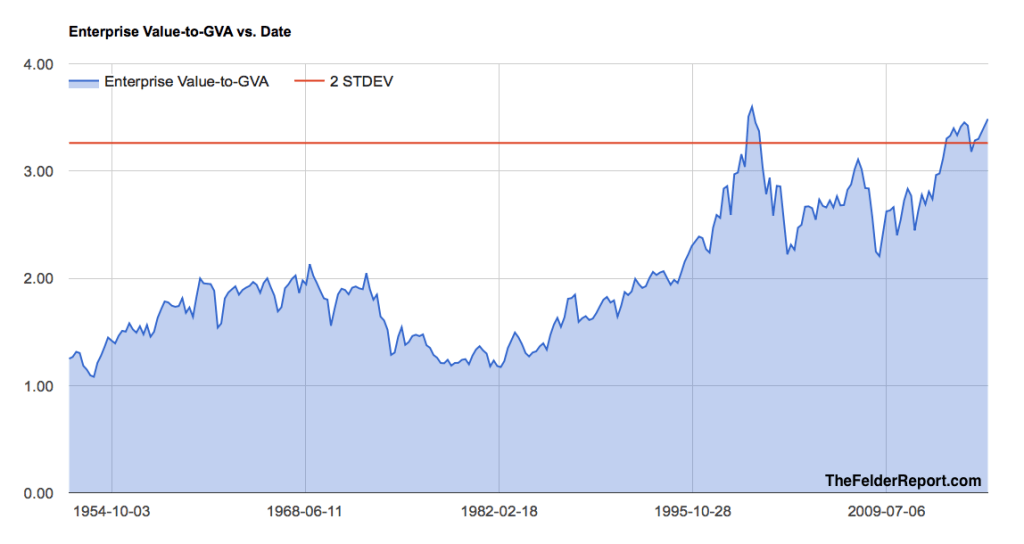
When we add debt into the equation we can account for this important dynamic. What we get is essentially an “enterprise value” to sales measure. It’s a subtle change but an important one. After the rally in stocks over the past several months and the massive corporate debt issuance over that same period, U.S. total nonfinancial corporate enterprise value relative to sales is hitting new multi-year highs.
It has now nearly matched its peak from the dotcom mania. And if that earlier time is widely accepted as a textbook financial bubble, what should we call the current market environment? Or if you’re of more of a statistical mind, I would point out that the current level is currently beyond two standard deviations of its long-term average, precisely how Jeremy Grantham defines the term, “financial bubble.”
Copyright © The Felder Report