by LPL Research
August historically has been one of the more volatile months, but 2016 has been anything but that. As we noted at the start of the month in “Time For An August Swoon?” the month of August is one of two months (along with September) that has averaged a negative monthly return for the S&P 500 going back to 1980. Even more worthwhile though, is that no month averages a larger decline during its down months. Look no further than recent years and the drops we’ve seen in August, from the 2011 U.S. debt downgrade in 2011 and consequent 5.7% drop, to the China yuan devaluation inducing a 6.3% drop last August. For whatever reason, when August is red, it tends to see a rather large drop.
Well, 2016 isn’t playing to the script at all, as the CBOE Volatility Index (VIX) recently traded at its lowest level in two years, beneath 12, and the S&P 500 soared to new highs as well. The new equity highs took place even though no month has made fewer new highs than August. Not to mention, the S&P 500 has now gone 28 consecutive days without a 1% move (up or down)—the longest such streak since 32 days in a row ending late September 2014.
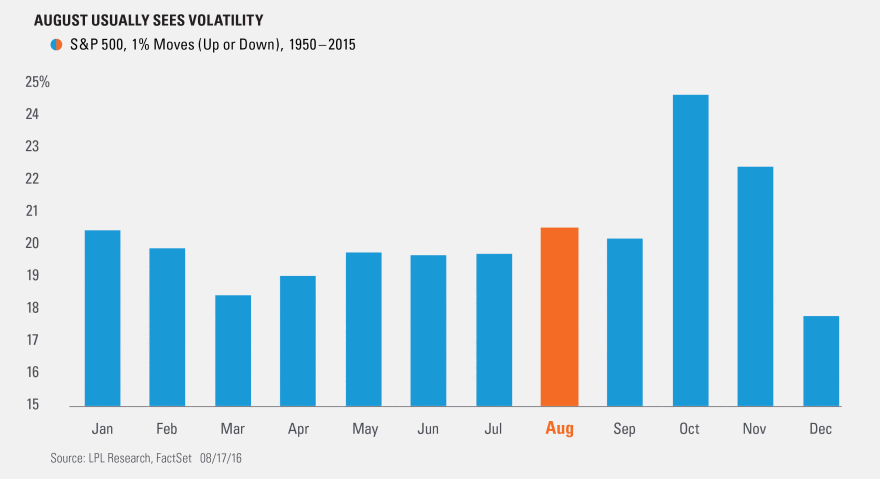
How often do we see a 1% move (up or down) in August? Going back to 1950, 20.6% of all the days in August move 1% or more. Only October and November are higher.
The last time the entire calendar month of August went the full month without a 1% move was in 1995. Interestingly, July has gone the longest out of all months without a 1% move—as 1976 was the last time it didn’t see a 1% move during a month. Back to August, there have been seven times since 1950 the full month of August hasn’t had a 1% move, and the rest of the year (September until year-end) was up all seven times with an average return of 6.2%. For reference, the average September until year-end return is 3.6% for all years from 1950 to 2015.
There is still a long way to go before August is over, but so far 2016 has been a historically calm month. Should the rest of the month stay this way, it could bode well for gains the rest of the year, but we’ll cross that bridge when we get there.
*****
IMPORTANT DISCLOSURES
Past performance is no guarantee of future results. All indexes are unmanaged and cannot be invested into directly. Unmanaged index returns do not reflect fees, expenses, or sales charges. Index performance is not indicative of the performance of any investment.
The economic forecasts set forth in the presentation may not develop as predicted.
The opinions voiced in this material are for general information only and are not intended to provide or be construed as providing specific investment advice or recommendations for any individual security.
Stock investing involves risk including loss of principal.
The S&P 500 Index is a capitalization-weighted index of 500 stocks designed to measure performance of the broad domestic economy through changes in the aggregate market value of 500 stocks representing all major industries.
This research material has been prepared by LPL Financial LLC.
To the extent you are receiving investment advice from a separately registered independent investment advisor, please note that LPL Financial LLC is not an affiliate of and makes no representation with respect to such entity.
Not FDIC/NCUA Insured | Not Bank/Credit Union Guaranteed | May Lose Value | Not Guaranteed by any Government Agency | Not a Bank/Credit Union Deposit
Securities and Advisory services offered through LPL Financial LLC, a Registered Investment Advisor
Member FINRA/SIPC
Tracking #1-527520 (Exp. 08/17)


