
The Price of Safety
by Anthony Valeri, Fixed Income and Investment Strategist, LPL Financial
KEY TAKEAWAYS
· Slow growth and negative interest rate policies have created an environment where it is difficult for bond investors to find value.
· The stretch for yield has caused income investors to take on more risk, and has stretched valuations of less traditional income sectors as well.
· Safety is a concern for all investors, but they may not realize just how expensive the price of safety has become.
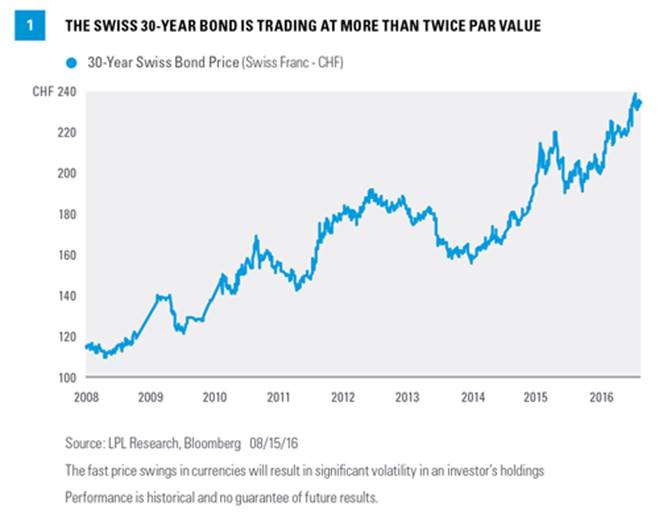
Slow global growth and low or negative interest rate policies from major central banks make for a difficult environment for income investors. U.S. yields are low relative to history, but overseas investors have it even worse, with central banks in many developed nations pursing negative interest rate policies that have pushed government bond prices to all-time highs. Figure 1 shows the price of one such bond, the 30-year Swiss government bond, which is currently trading at a price of 235 Swiss francs, more than double the typical “par” price of 100 that results in an investor receiving the stated coupon on a bond.
U.S. Treasuries and other government bonds may be considered “safe haven” investments but do carry some degree of risk including interest rate, credit and market risk. U.S. Treasuries are guaranteed by the U.S. government as to the timely payment of principal and interest and, if held to maturity, offer a fixed rate of return and fixed principal value.
SAFETY ISN’T CHEAP
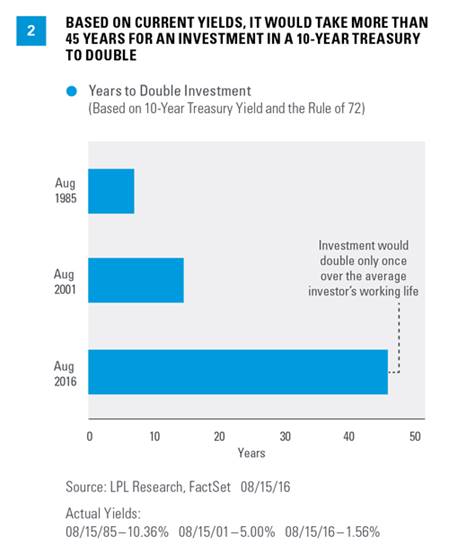
U.S. Treasury yields are higher than their foreign counterparts, but yields have been on a downward trajectory for more than 30 years. The rule of 72 is a common shortcut in which 72 is divided by an investment’s annual return to determine the number of years it will take for an investor’s money to double. Thirty-one years ago, in August 1985, investors were able to receive a yield of more than 10% on a 10-year Treasury, allowing their money to double in approximately 7 years with very little risk of default. Moving forward to 2001, the 10-year Treasury yielded closer to 5%, meaning it would take 14 years for an investor’s money to double. Fast-forward to 2016, and it would now take more than 45 years to double an investment in a 10-year Treasury [Figure 2], or put another way—the investment would double only once during the average investor’s working life.
The rule of 72 is a mathematical concept and does not guarantee investment results nor functions as a predictor of how an investment will perform. It is an approximation of the impact of a targeted rate of return. Investments are subject to fluctuating returns and there is no assurance that any investment will double in value.
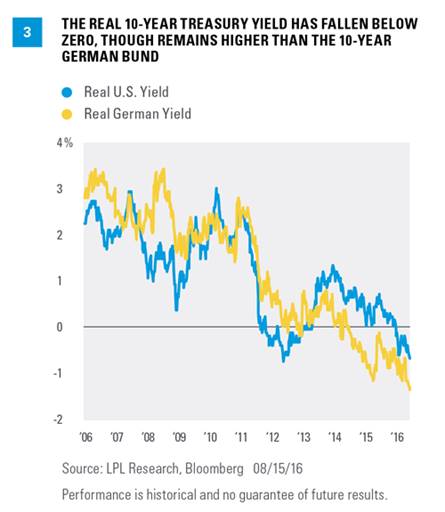
Though nominal yields remain well above zero in the U.S., real yields (yields adjusted for the impact of inflation) have fallen into negative territory, though not as far as other developed nations, such as Germany [Figure 3].
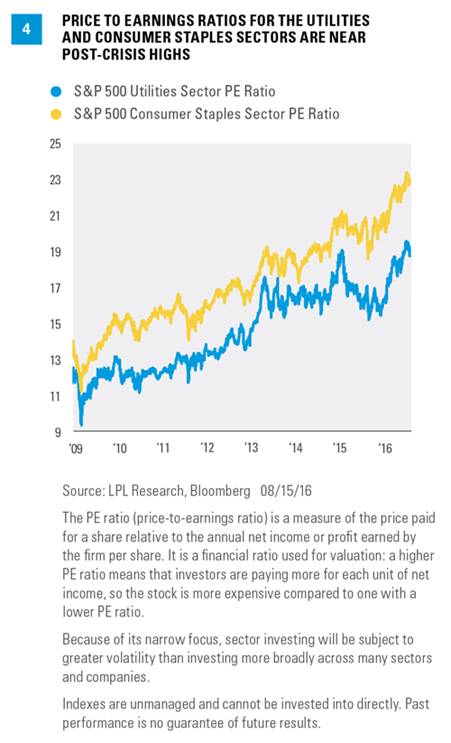
The grab for yield has led to above-average valuations not only in the bond market, but also in some areas of the equity market. Sectors such as utilities, consumer staples, and real estate investment trusts (REIT) have seen strong year-to-date gains (19.7%, 10.4%, and 15.5%, respectively[1]), and price-to-earnings ratios (PE) for the former two sectors are near post-crisis highs [Figure 4]. The PE ratio of the S&P 500 utilities sector, at 18.7, is well above its post-1990 average of 14.8, and the consumer staples sector is at an even higher multiple of 23, versus a post-1990 average of 19.8. Forward valuations, measured by price to funds from operations (PFFO), for the REIT sub-sector of the S&P 500 (which will soon become a sector of its own), are also toward the top of their post-crisis range. All three sectors continue to offer a higher level of income than the overall S&P 500, and distribution levels for the REIT sub-sector have actually increased slightly year to date; although utilities and consumer staples have seen yields fall more quickly than those of the overall S&P 500 year to date, as valuations have increased.
Telecom is another income-oriented sector that has seen strong year-to-date performance (+24%, as measured by the S&P 500 telecommunications sector), though the fact that two stocks make up more than 90% of the market capitalization of the sector means returns are driven more by the performance of individual companies, making comparisons less meaningful.
While the low-rate environment and demand for yield have helped the performance of these sectors, investors may be paying too high a price for safety of these traditionally less volatile areas of the stock market. The high valuations of not only high-quality bonds but also defensive equity sectors should be questioned by prudent investors with a long-term horizon. Areas of stock and bond markets traditionally considered “conservative” or “safe” may provide short-term confidence given stubbornly low interest rates, but may fail to help investors achieve longer 5-, 10- or 20-year objectives. Investors may be taking on more risk than they are aware, given that stock prices, historically, tend to be more volatile than bonds over time, and that a rise in interest rates also remains a risk for these sectors.
CONCLUSION
The price of safety has increased in recent years, leading investors to move into more volatile areas of the market in order to obtain reasonable yields. Although this stretch has worked so far, aided by historic liquidity from global central banks that has helped to drive asset prices higher, investors may be overpaying for perceived safety and peace of mind. While yields remain historically low and recent central bank actions point to potentially lower rates for longer, a sudden increase in economic growth or inflation (for headline inflation, this could be driven by something as benign as oil prices remaining at current levels), which drives rates higher could surprise investors in rate-sensitive sectors, including defensive equities. Investors should take the time now to assess the overall risk levels of their portfolios, as principal losses from a move higher in interest rates may easily overwhelm the benefits of additional yield, especially given the stretched valuations of many income-oriented sectors of the market.
IMPORTANT DISCLOSURES
The opinions voiced in this material are for general information only and are not intended to provide specific advice or recommendations for any individual. To determine which investment(s) may be appropriate for you, consult your financial advisor prior to investing. All performance reference is historical and is no guarantee of future results. All indexes are unmanaged and cannot be invested into directly.
The economic forecasts set forth in the presentation may not develop as predicted and there can be no guarantee that strategies promoted will be successful.
Bonds are subject to market and interest rate risk if sold prior to maturity. Bond values and yields will decline as interest rates rise, and bonds are subject to availability and change in price.
Government bonds and Treasury bills are guaranteed by the U.S. government as to the timely payment of principal and interest and, if held to maturity, offer a fixed rate of return and fixed principal value. However, the value of fund shares is not guaranteed and will fluctuate.
International debt securities involves special additional risks. These risks include, but are not limited to, currency risk, geopolitical and regulatory risk, and risk associated with varying settlement standards. These risks are often heightened for investments in emerging markets.
Because of its narrow focus, sector investing will be subject to greater volatility than investing more broadly across many sectors and companies.
Investing in real estate investment trusts (REITs) involves special risks such as potential illiquidity and may not be suitable for all investors. There is no assurance that the investment objectives of this program will be attained.
INDEX DESCRIPTIONS
The Standard & Poor’s 500 Index is a capitalization-weighted index of 500 stocks designed to measure performance of the broad domestic economy through changes in the aggregate market value of 500 stocks representing all major industries.
The S&P Consumer Staples Index is comprised of companies whose businesses are less sensitive to economic cycles. It includes manufacturers and distributors of food, beverages, and tobacco, and producers of nondurable household goods and personal products. It also includes food and drug retailing companies.
The S&P Utilities Index is comprised primarily of companies involved in water and electrical power and natural gas distribution industries.