With 100 Days Left in 2016, Should You Really “Sell Everything”?
by LPL Research
Yesterday marked 100 trading days left in 2016, making today a nice chance to reflect on what has happened this year and what might happen for the rest of 2016. As of yesterday, the S&P 500 was up 6.4% for the year, right in-line with the average year, which is up 4.9% as of August 10 (going back to 1950). When you consider the S&P 500 was down 10% for the year after 28 days, the worst start to a year ever, the rebound is all the more impressive.
Another constant we’ve noticed over the past year is continued big calls from some influential names that note many reasons why lower equity prices could be coming. This article by Jeff Cox of CNBC.com discusses some of the high-profile bearish calls in more detail.
In fact, just this week, long time bear Marc Faber sees the S&P 500 going down to 1,100 eventually. We saw similar calls to sell in early February. Many strategists and firms drastically lowered their year-end targets back in February, but here at LPL Research, we fortunately stuck to our call of mid- to high-single-digit total equity returns this year.* It wasn’t easy at the time, but we are happy with the results so far.
As we now face more high-profile calls to get out of equities, what do we think? We continue to expect the potential remains for higher prices and that any pullbacks may be shallow and could be used as buying opportunities. (For more of our overall views, be sure to take another look at our Midyear Outlook 2016.) Even yesterday on the blog we noted why the Nasdaq going a long time without a new all-time high historically has led to higher prices in the near term, after that first new high.
One other potential reason not to sell everything here and now is what has happened with 100 days to go. Going back to 1928, the S&P 500 has been higher year to date 56 times with 100 days to go. The rest of the year has averaged a return of 4.2% and has been higher 83.9% of the time. The flip side is when it is down year to date with 100 days to go, the rest of the year is down 2.3% on average and higher only 42.9% of the time. In other words, a strong start to a year historically leads to higher prices to end the year and vice versa.
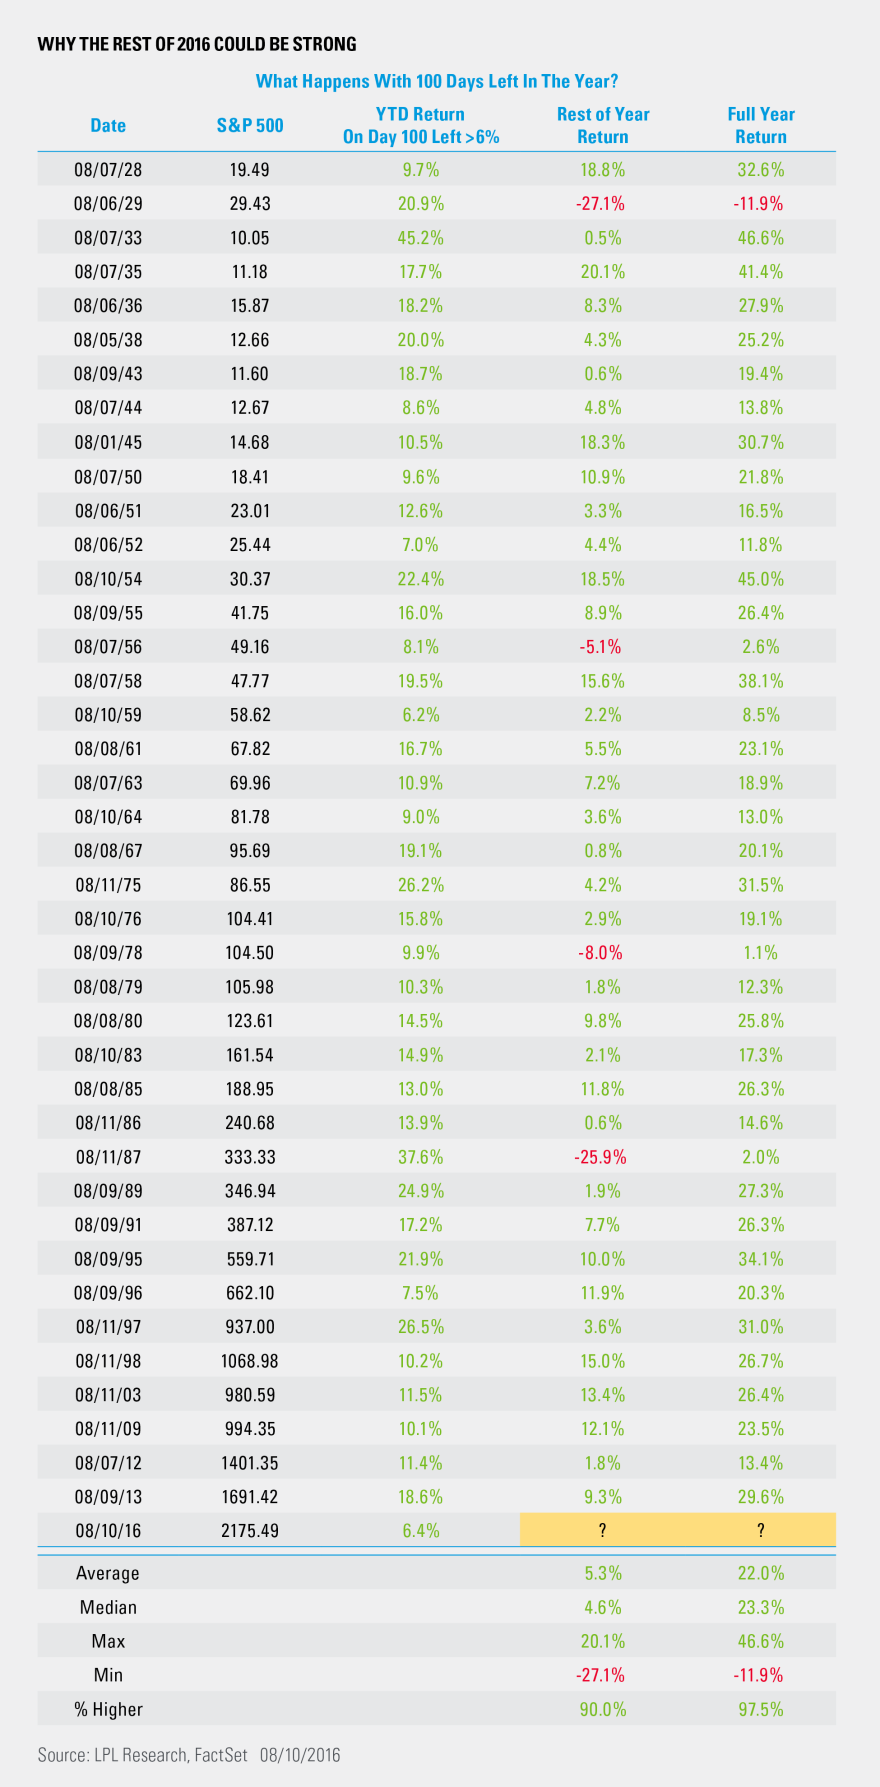
Now, what happens if it is a strong year? There have been 40 other times the S&P 500 was up more than 6% for the year with 100 days to go (like 2016), and incredibly, the rest of the year is up 5.3% on average and higher 90% of the time. Thus, a strong start to the year has led to even stronger returns for the rest of the year. What about the full-year returns? Only once in history has the S&P 500 been up more than 6% with 100 days to go and finished red, and that was in 1929. Therefore, 39 of the previous 40 times the full year finished green, making the chances for a massive sell-off during the rest of this year rather slim.
There are many reasons to worry; and with so many informed people calling for much lower prices, it can be tough to stick with your process. Here at LPL Research we are aware of the worries, but continue to see more reasons to remain optimistic about potential equity returns. Be sure to follow us on this blog and via our Weekly Market Commentaries for continued insight on what we are seeing unfold in real time.
*****
IMPORTANT DISCLOSURES
*We continue to expect mid-single-digit returns for the S&P 500 in 2016, consistent with historical mid-to-late economic cycle performance. We expect those gains to be derived from mid- to high-single-digit earnings growth over the second half of 2016, supported by steady U.S. economic growth and stability in oil prices and the U.S. dollar. A slight increase in price-to-earnings ratios (PE) above 16.6 is possible as market participants gain greater clarity on the U.S. election and the U.K.’s relationship with Europe.
Past performance is no guarantee of future results. All indexes are unmanaged and cannot be invested into directly. Unmanaged index returns do not reflect fees, expenses, or sales charges. Index performance is not indicative of the performance of any investment.
The economic forecasts set forth in the presentation may not develop as predicted.
The opinions voiced in this material are for general information only and are not intended to provide or be construed as providing specific investment advice or recommendations for any individual security.
Stock investing involves risk including loss of principal.
The S&P 500 Index is a capitalization-weighted index of 500 stocks designed to measure performance of the broad domestic economy through changes in the aggregate market value of 500 stocks representing all major industries.
This research material has been prepared by LPL Financial LLC.
To the extent you are receiving investment advice from a separately registered independent investment advisor, please note that LPL Financial LLC is not an affiliate of and makes no representation with respect to such entity.
Not FDIC/NCUA Insured | Not Bank/Credit Union Guaranteed | May Lose Value | Not Guaranteed by any Government Agency | Not a Bank/Credit Union Deposit
Securities and Advisory services offered through LPL Financial LLC, a Registered Investment Advisor
Member FINRA/SIPC
Copyright © LPL Research


