Earnings update: We were hoping for more
by Burt White, Chief Investment Officer, LPL Financial
KEY TAKEAWAYS
· We were hoping for more out of corporate America this earnings season.
· Although the numbers have not been great, there have been some encouraging signs.
· The tech sector has produced solid results and forward estimates have been resilient.
Second quarter earnings season has been okay, but we were hoping for more. S&P 500 earnings are tracking to a 2.6% year-over-year decline in the second quarter of 2016, which means the earnings recession is poised to continue. The quarterly decline would make four in a row according to Thomson Reuters data (by FactSet’s count, the streak is five). Although the numbers for the quarter were not great, there have been some encouraging signs. The technology sector has produced solid results, and forward estimates have been resilient overall. This week we provide an overview of earnings season and discuss prospects for a second half earnings rebound. Later this month we will update our Corporate Beige Book barometer, an analysis of the topics covered in companies’ earnings conference calls.

Second quarter earnings by the numbers
With 428 S&P 500 constituents having reported second quarter results, S&P 500 earnings are tracking toward a 2.6% year-over-year decline, just 1.2% better than expectations as of quarter end (June 30, 2016). The second quarter of 2016 will also mark the fourth straight quarterly decline in one of the longest earnings recessions outside of an economic recession ever (read more on the earnings recession in this Thought Leadership publication).
But among those dreary headlines, there is some good news:
· The second quarter results help to solidify the first quarter of 2016 as a trough in earnings growth.
· S&P 500 profit margins are near record highs, excluding energy.
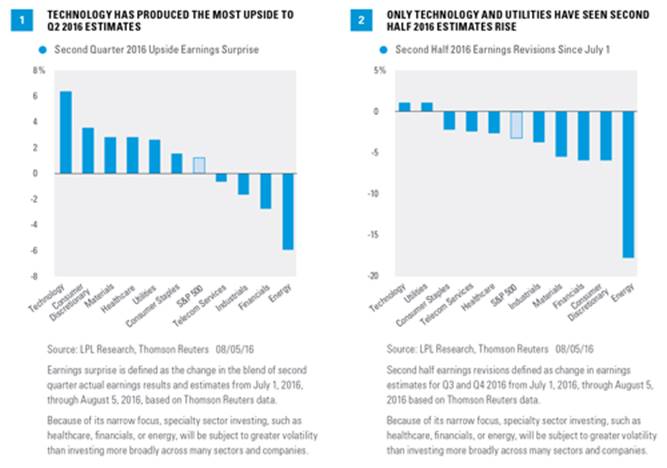
· The technology sector produced significant upside to prior second quarter forecasts, with positive revisions to third and fourth quarter estimates.
· S&P 500 revenue came within 0.5% of a year-over-year gain and is up 3% year-over-year, excluding energy.
· Pre-announcements have been less negative than the historical average. The ratio of negative-to-positive pre-announcements for the third quarter, at 2.4, is better than the long-term historical average (2.7).
· Forward four quarters earnings estimates have fallen by a below-average 0.8% since earnings season began.
At the same time, there have been some disappointments:
· Backing out headwinds from oil prices and the dollar still get us to only about 2% year-over-year earnings growth, a weak pace for this stage of the business cycle; moreover, the U.S. dollar comparison versus the year ago quarter suggests less currency drag than we have seen.
· Despite easing drags from oil and the dollar, the S&P 500 may not be able to generate the average earnings upside to prior forecasts of about 3%.
· The bars for the energy and industrials sectors were not low enough. Energy has missed second quarter estimates by more than 6%, while the industrials sector has fallen 1.6% short thus far.
Technology was a standout performer
The clear highlight of this earnings season has been the technology sector, which has produced the biggest upside surprise in the quarter of any sector, at more than 6% [Figure 1], and a positive revision to estimates for the second half of the year—the only sector besides utilities that can make that claim [Figure 2]. The sector has benefited from powerful shifts toward mobile and cloud computing, as well as the continued strong trends in ecommerce. With each passing day, these growth areas become a bigger share of sector revenue and, with their better profit margins, improve the profitability and growth profile of the technology sector.
Technology remains one of our favorite sectors for the second half of the year based on the potential pickup in growth and attractive valuations.

What Brexit?
In our earnings preview commentary, we wrote that the United Kingdom’s (U.K.) decision to leave the European Union (EU) would have a limited impact on S&P 500 earnings and that is indeed what we have seen. Most companies that have cited Brexit as a potential business risk have noted that it is too early for them to predict what the impact might eventually be. For those who have been affected, it has been through the currency (the British pound has fallen 13% versus the U.S. dollar since the late June vote). But just because the impact has been minimal thus far does not mean the topic has not been popular on earnings calls. According to Bespoke, 49% of companies’ earnings calls for the one month ending July 28, 2016, included at least one Brexit mention. We will have more on Brexit in our Corporate Beige Book commentary coming up in the next couple of weeks (for reference, you may view the first quarter’s Corporate Beige Book here).
Prospects for second half rebound
We continue to expect earnings to rebound in the second half of the year. The U.S. economy should help. The latest data have gross domestic product (GDP) for the third quarter tracking between 2.5% and 3.5%, and the fourth quarter could reach similar levels as the recent drawdown in inventories reverses. Recent readings on the Institute for Supply Management’s (ISM) Manufacturing Index, one of our favorite earnings indicators, have been solidly in expansion territory (five straight months over 50), with particular strength in new orders and production.
Other positive factors include:
· Companies continue to display great cost efficiency, keeping margins near record highs, excluding the energy sector.
· The U.S. dollar has stabilized in a lower range in recent months, despite the sharp drop in the British pound, and may have little or no impact on earnings over the next six months after being a significant drag over the past year.
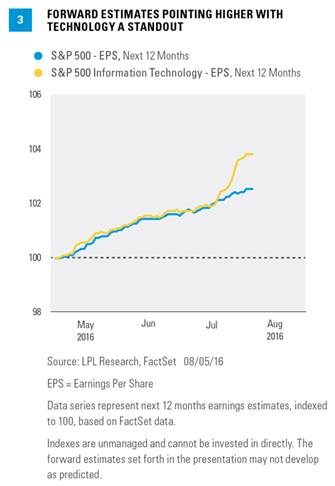
· Estimates for the second half of 2016 and first half of 2017 have only come down 0.8% since earnings season began, better than average and a positive sign. Figure 3 shows forward estimates rising because July 2016 results have rolled off and have been replaced by higher estimates in July 2017.
· The ratio of negative-to-positive pre-announcements, at 2.4, is slightly better than the long-term average of 2.7, though a bit worse than last quarter’s 2.1.

One potential fly in the ointment is oil. After oil prices roughly doubled from the February 2016 lows in the mid-$20s to over $51 in early June, the commodity has since entered a bear market with a 20% decline. After closing below $40 on August 2, oil has moved higher over the past three trading days to close at $41.80 on Friday. Should oil remain at current levels, or fall, energy sector estimates for the next two quarters may be difficult to achieve and the energy-oriented segments of the industrials sector may see some incremental weakness.
Brexit also remains a risk and may have more impact on results once the U.K. begins the actual process of exiting the EU. All in all, we see the potential for a rebound to mid-single-digit earnings growth for the S&P 500 by year-end.*
*As noted in our Midyear Outlook 2016 publication, we continue to expect mid-single-digit returns for the S&P 500 in 2016, consistent with historical mid-to-late economic cycle performance. We expect those gains to be derived from mid- to high-single-digit earnings growth over the second half of 2016, supported by steady U.S. economic growth and stability in oil prices and the U.S. dollar. A slight increase in price-to-earnings ratios (PE) above 16.6 is possible as market participants gain greater clarity on the U.S. election and the U.K.’s relationship with Europe.
Conclusion
Second quarter earnings season has been better than some had feared, but we had hoped for more. Still, there have been encouraging signs. The technology sector has produced solid results and forward estimates have been resilient. We continue to expect a second half earnings rebound. Look for more on earnings from us in the weeks ahead with our Corporate Beige Book barometer, an analysis of the topics covered in companies’ earnings conference calls.
***
IMPORTANT DISCLOSURES
The opinions voiced in this material are for general information only and are not intended to provide specific advice or recommendations for any individual. To determine which investment(s) may be appropriate for you, consult your financial advisor prior to investing. All performance referenced is historical and is no guarantee of future results.
The economic forecasts set forth in the presentation may not develop as predicted and there can be no guarantee that strategies promoted will be successful.
Investing in stock includes numerous specific risks including: the fluctuation of dividend, loss of principal, and potential liquidity of the investment in a falling market.
Because of its narrow focus, specialty sector investing, such as healthcare, financials, or energy, will be subject to greater volatility than investing more broadly across many sectors and companies.
The fast price swings in commodities and currencies will result in significant volatility in an investor’s holdings.
All investing involves risk including loss of principal.
INDEX DESCRIPTIONS
The Standard & Poor’s 500 Index is a capitalization-weighted index of 500 stocks designed to measure performance of the broad domestic economy through changes in the aggregate market value of 500 stocks representing all major industries.
The U.S. Institute for Supply Management (ISM) Purchasing Managers’ Index (PMI) is an economic indicator derived from monthly surveys of private sector companies, and is intended to show the economic health of the U.S. manufacturing sector. A PMI of more than 50 indicates expansion in the manufacturing sector, a reading below 50 indicates contraction, and a reading of 50 indicates no change.


