by Don Vialoux, Timingthemarket.ca
Editor’s Notes: Mr. Vialoux is scheduled to appear on “Berman’s Call” at 11:00 AM EDT today
Pre-opening Comments for Monday August 8th
U.S. equity index futures were higher this morning. S&P 500 futures were up 4 points in pre-opening trade.
Vail Resorts has offered to acquire Whistler Blackcomb in a cash and share deal valued at Cdn.$1.39 billion. Each share of Whistler Blackcomb will receive $17.50 cash and 0.0975 shares of Vail Resorts.
Second quarter reports are starting to wind down. Reports released this morning included Tyson Food, Allergan and Dean Foods.
Delta Airlines dropped $0.68 to $36.99 after all flights were cancelled when Delta’s computer system shut down.
Monsanto (MON $106.93) is expected to open higher after Monness upgraded the stock to buy from neutral.
EquityClock’s Daily Market Comment
Following is a link:
http://www.equityclock.com/2016/08/05/stock-market-outlook-for-august-8-2016/
Note seasonality charts on Non-farm Payrolls, Canadian Employment, U.S. Financials, Technology, 10 year Treasury yields, and the VIX Index
Mr.Vialoux was on BNN’s Market Call Tonight on Friday. Following are links:
http://www.bnn.ca/video/don-vialoux-s-top-picks~925512 Top picks
http://www.bnn.ca/video/don-vialoux-s-past-picks~925498 Past picks
http://www.bnn.ca/video/don-vialoux-discusses-suncor~925501 Comment on Suncor
http://www.bnn.ca/video/don-vialoux-discusses-vale~925499 Comment of Vale
http://www.bnn.ca/video/don-vialoux-discusses-johnston-controls~925494 Comment on Johnson Controls
http://www.bnn.ca/video/don-vialoux-discusses-scotiabank~925469 Comment on Scotia Bank
http://www.bnn.ca/video/don-vialoux-discusses-ipaht-sa-vis-short-term-futures-etf~925493 Comment on the VIX Index
Economic News This Week
Second Quarter Productivity to be released at 8:30 AM EDT on Tuesday is expected to increase 0.5% versus a decline of 0.6% in the first quarter
Canadian July Housing Starts to be released at 8:15 AM EDT on Tuesday are expected to drop to 195,000 from 218,333 in June.
June Wholesale Inventories to be released at 10:00 AM EDT on Tuesday are expected to increase 0.2% versus a gain of 0.1% in May.
Weekly Initial Jobless Claims to be released at 8:30 AM EDT on Thursday are expected to slip to 266,000 from 269,000 last week.
July Producer Prices to be released at 8:30 AM EDT on Friday are expected to be unchanged versus a gain of 0.5% in June. Excluding food and energy, July Producer Prices are expected to increase 0.2% versus a gain of 0.4% in June.
July Retail Sales to be released at 8:30 AM EDT on Friday are expected to increase 0.4% versus a gain of 0.6% in June. Excluding auto sales, July Retail Sales are expected to increase 0.2% versus a gain of 0.7% in June.
June Business Inventories to be released at 10:00 AM EDT on Friday are expected to increase 0.1% versus a gain of 0.2% in May.
August Michigan Sentiment Index to be released at 10:00 AM EDT on Friday is expected to increase to 90.2 from 90.0 in July.
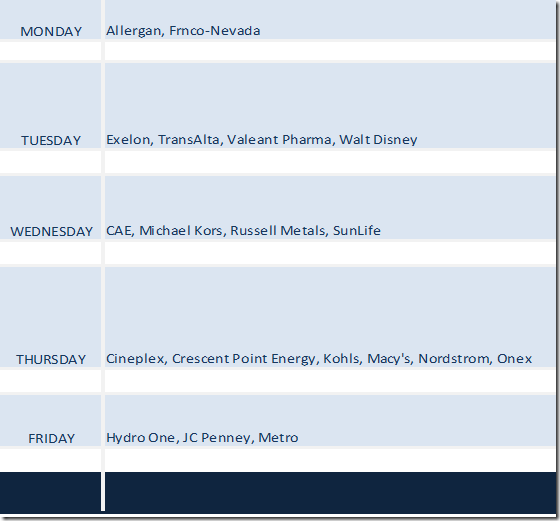
Earnings News This Week
The Bottom Line
Technical, seasonal and fundamental factors point to a strong possibility of start of an intermediate correction by equity markets and economic sensitive sectors despite strength in equity markets on Friday. Traders and seasonal investors should respond accordingly.
Observations
Strength in North American equity markets on Friday on a better than expected U.S. employment report was a surprise. However, breakouts by the S&P 500 Index to an all-time high and the TSX Composite Index to a one year high were not convincing. Most of the technical action on the upside was realized in one sector, the financials on anticipation of improving credit spreads. Breakouts were not accompanied with higher volumes, a warning sign. Looking at the S&P 500 Momentum Barometer and the TSX Momentum Barometer, strength took intermediate overbought equity markets to a higher overbought level.
The employment report on Friday, particularly the greater than expected increase in hourly wages, increased chances for a raise in the Fed Fund rate in September, an event that equity markets will not anticipate favourably.
Economic focuses this week are on July Retail Sales and July Producer Prices released on Friday
The release of second quarter reports passed their peak in the U.S. last week and will reach their peak in Canada this week. 86% of S&P 500 companies have reported to date. Blended earnings on a year-over-year basis were down 3.5% while revenues were unchanged. 69% of S&P 500 companies reported higher than consensus second quarter earnings and 54% reported higher than consensus revenues.
This week sees another 23 S&P 500 companies and one Dow company (Disney) reporting results. Focus is on Retail Merchandisers. The focus in Canada is on energy companies. They “won’t be pretty”.
Third quarter guidance by S&P 500 companies continues to turn negative. 53 companies have issued negative guidance while 26 companies have issued positive guidance. Accordingly, analyst ounce again lowered their third and fourth quarter earnings estimates. Consensus for year-over-year third quarter earnings by S&P 500 companies dropped last week to a loss of 1.7% from a loss of 0.6% and consensus for fourth quarter earnings dropped to a gain of 5.7% from a gain of 6.3%. Revenues are expected to increase 2.2% in the third quarter and 4.9% in the fourth quarter.
Volatility in North American equity markets remains low. However, the VIX Index needs to be watched closely. This is the time of year when “one off” events impacting equity markets frequently occur. Possibilities include greater uncertainty related to the U.S. Presidential election, a major terrorist event, a blow up by Italian banks, further economic deterioration by China, a major hurricane hitting the U.S. Gulf coast, currency wars, an increase in the Fed Fund rate in September or ….
Short term technical indicators for most equity markets and economic sensitive sector (other than financials) continue to trend down despite their strength on Friday.
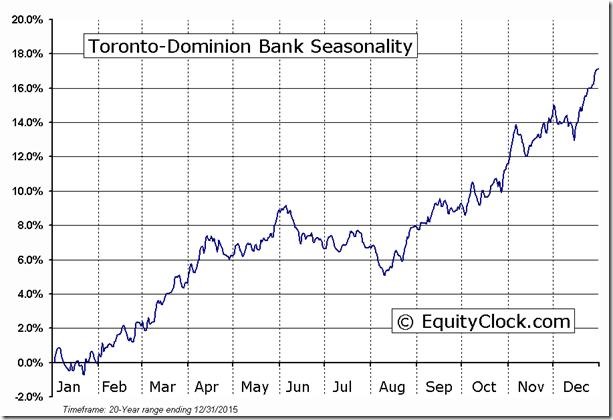
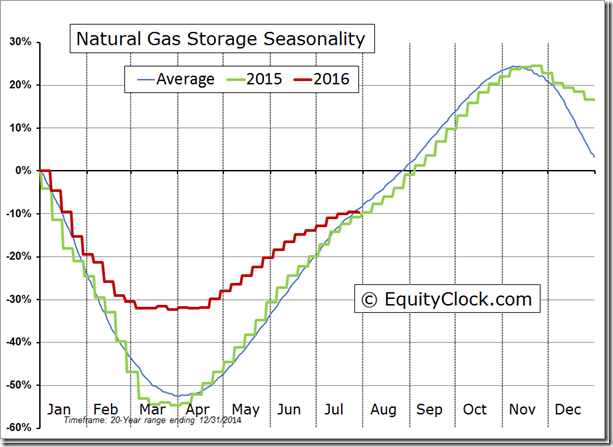
The end of July/ beginning of August historically have been a period of rotation out of economic sensitive sectors and into precious metal stocks. Seasonal trades are possible in Canadian banks and “gassy” stocks
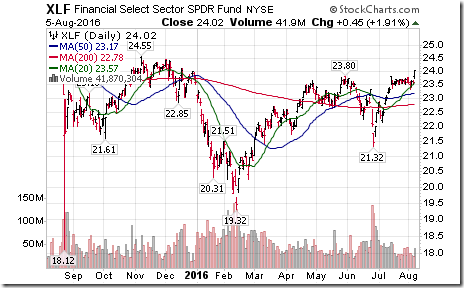
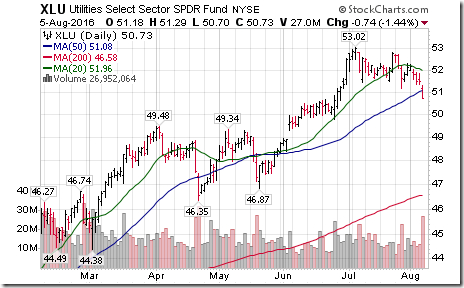
Technical action by S&P 500 stocks last week was quietly bullish: 37 stocks broke resistance and 23 stocks broke support. Notable among stocks breaking resistance were financials. Notable among stocks breaking support were utilities. Of the 500 stocks, 334 are in intermediate uptrends, 57 are in neutral trends and 119 are in downtrends.
Equity Indices and Related ETFs
Daily Seasonal/Technical Equity Trends for August 5th 2016
Green: Increase from previous day
Red: Decrease from previous day
Calculating Technical Scores
Technical scores are calculated as follows:
Intermediate Uptrend based on at least 20 trading days: Score 2
Higher highs and higher lows
Intermediate Neutral trend: Score 0
Not up or down
Intermediate Downtrend: Score -2
Lower highs and lower lows
Outperformance relative to the S&P 500 Index: Score: 2
Neutral Performance relative to the S&P 500 Index: 0
Underperformance relative to the S&P 500 Index: Score -2
Above 20 day moving average: Score 1
At 20 day moving average: Score: 0
Below 20 day moving average: -1
Up trending momentum indicators (Daily Stochastics, RSI and MACD): 1
Mixed momentum indicators: 0
Down trending momentum indicators: -1
Technical scores range from -6 to +6. Technical buy signals based on the above guidelines start when a security advances to at least 0.0, but preferably 2.0 or higher. Technical sell/short signals start when a security descends to 0, but preferably -2.0 or lower.
Long positions require maintaining a technical score of -2.0 or higher. Conversely, a short position requires maintaining a technical score of +2.0 or lower
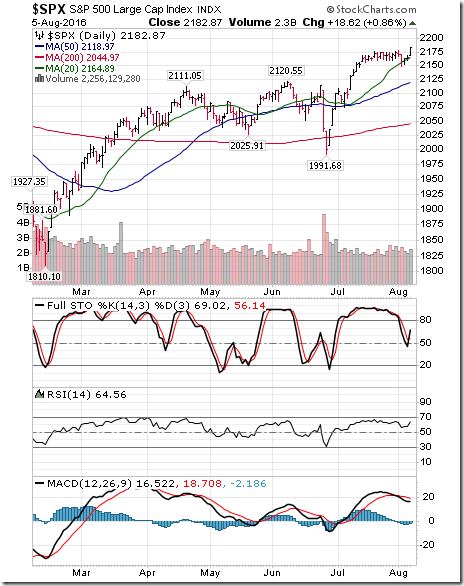
The S&P 500 Index gained 9.27 points (0.43%) last week. Intermediate uptrend was confirmed on Friday when the Index closed at an all-time high. The Index remains above its 20 day moving average. Short term momentum indicators are trending down despite gains recorded yesterday.
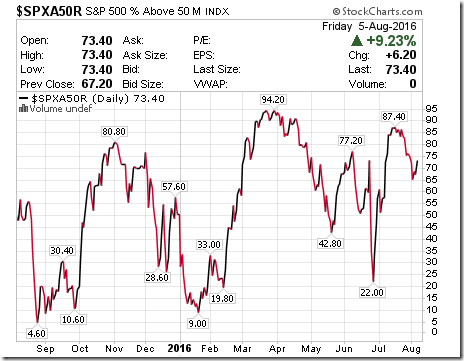
Percent of S&P 500 stocks trading above their 50 day moving average (also known as the S&P 500 momentum barometer) slipped last week to 73.40% from 75.80% despite the gain on Friday. Percent remains intermediate overbought and trending down.
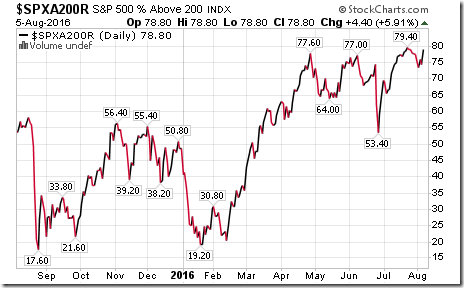
Percent of S&P 500 stocks trading above their 200 day moving average increased last week to 78.80% from 77.40%. Percent remains intermediate overbought and likely peaked two weeks ago at 79.40%.
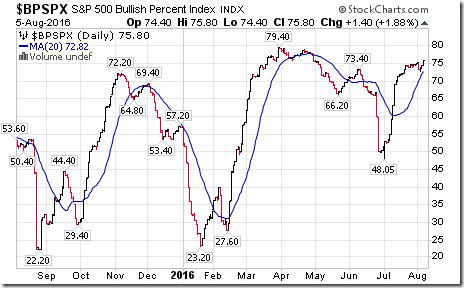
Bullish Percent Index for S&P 500 stocks increased last week to 75.80 from 74.80 and remained above its 20 day moving average. The Index remains intermediate overbought.
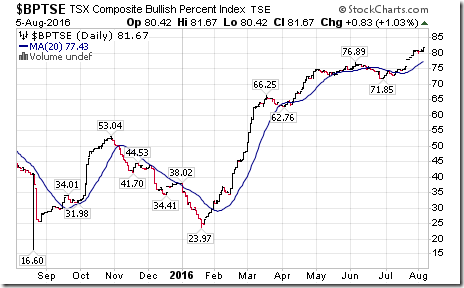
Bullish Percent Index for TSX Composite stocks increased last week to 81.67% from 80.83% and remained above its 20 day moving average. The Index remains intermediate overbought.
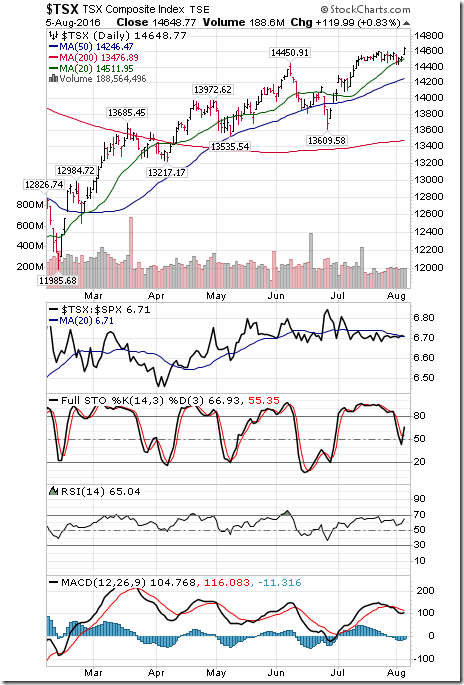
The TSX Composite Index added 66.05 points (0.45%) last week. Intermediate uptrend was confirmed on Friday when the Index reached a one year high (Score: 2). Strength relative to the S&P 500 Index remains neutral (Score: 0). The Index remained above its 20 day moving average (Score: 1). Short term momentum indicators are trending down despite the gain on Friday (Score: -1). Technical score remained last week at 2..
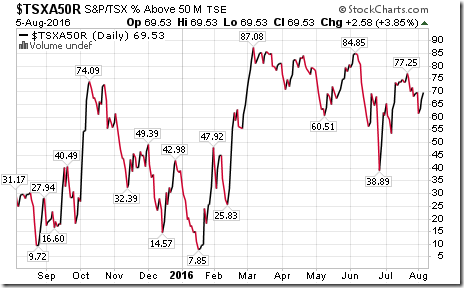
Percent of TSX stocks trading above their 50 day moving average (Also known as the TSX Composite Momentum Barometer) was unchanged last week at 69.53%. Percent remains intermediate overbought and trending down despite gains recorded on Friday.
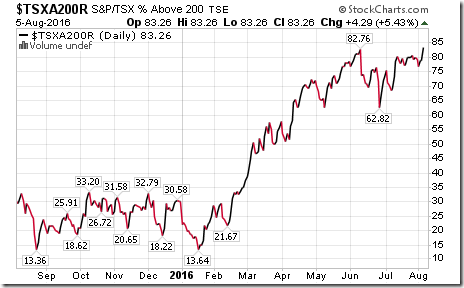
Percent of TSX stocks trading above their 200 day moving average increased last week to 83.26% from 79.40%. Percent remains intermediate overbought.
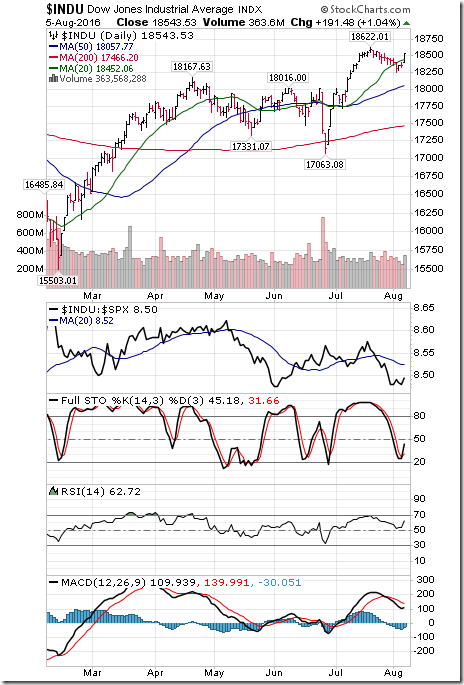
The Dow Jones Industrial Average gained 111.29 points (0.60%) last week. Intermediate trend remains up. Strength relative to the S&P 500 Index remains negative. The Average briefly moved below its 20 day moving average, but recovered above that level on Friday. Short term momentum indicators are trending down despite gains recorded on Friday. Technical score remained last week at 0.
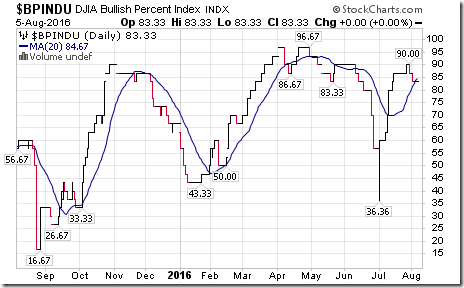
Bullish Percent Index for Dow Industrial Average stocks slipped last week to 83.33% and dropped below its 20 day moving average. The Index remains intermediate overbought and showing signs of rolling over.
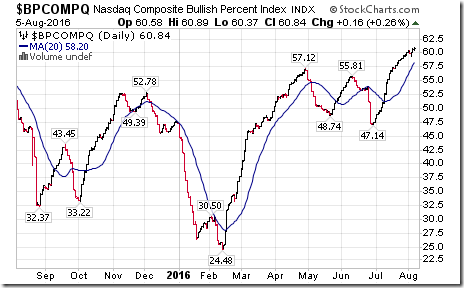
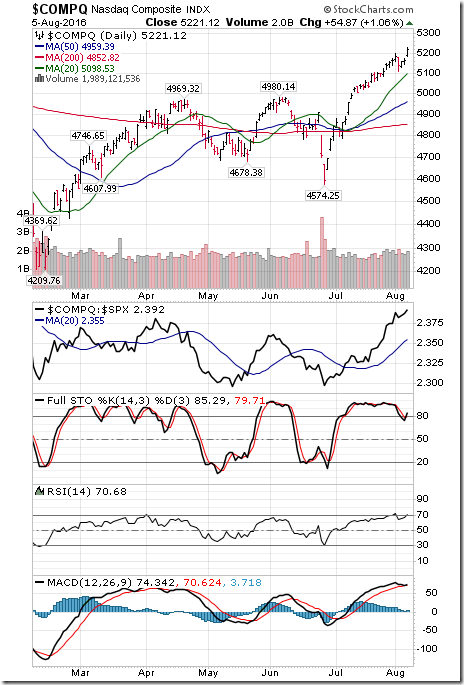
Bullish Percent Index for NASDAQ Composite stocks increased last week to 60.84% from 60.08% and remained above its 20 day moving average. The Index remains intermediate overbought.
NASDAQ Composite Index gained 58.99 points (1.14%) last week. Intermediate uptrend was confirmed on Friday when the Index closed at an all-time high. Strength relative to the S&P 500 Index remains positive. The Index remains above its 20 day moving average. Short term momentum indicators show early signs of rolling over from overbought levels. Technical score dipped last week to 4 from 6.
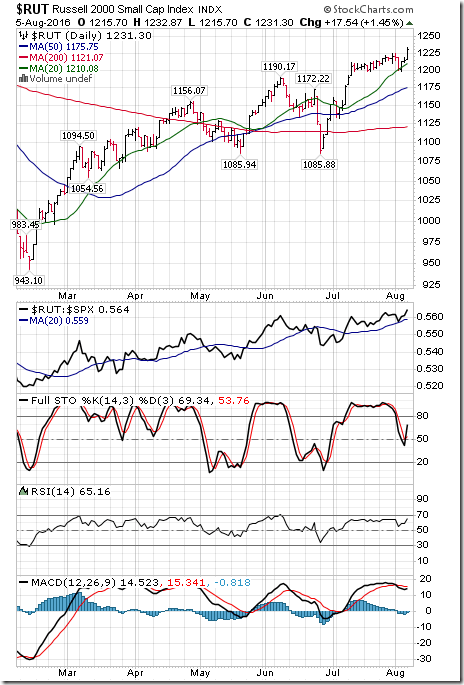
The Russell 2000 Index added 11.36 points (0.93%) last week. Intermediate trend remains up. Strength relative to the S&P 500 Index remains positive. The Index remains above its 20 day moving average. Short term momentum indicators are trending down despite gains recorded on Friday. Technical score slipped last week to 4 from 6.
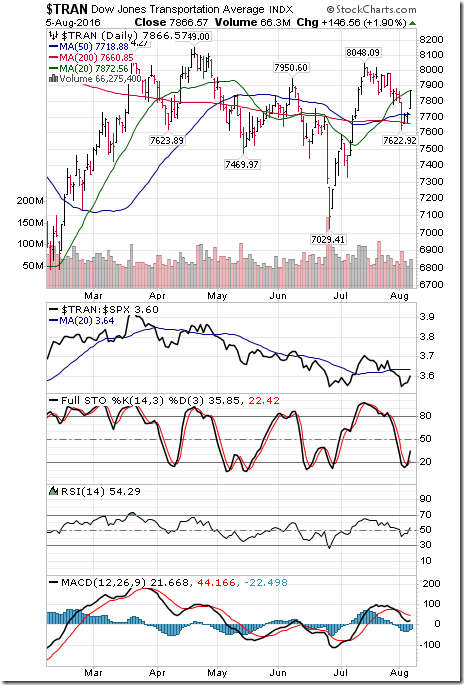
The Dow Jones Transportation Average gained 20.16 points (2.57%) last week. Intermediate trend remained neutral. Strength relative to the S&P 500 Index turned negative from neutral. The Average remained below its 20 day moving average. Short term momentum indicators are trending down despite gains recorded on Friday. Technical score dropped last week to -4 from 2
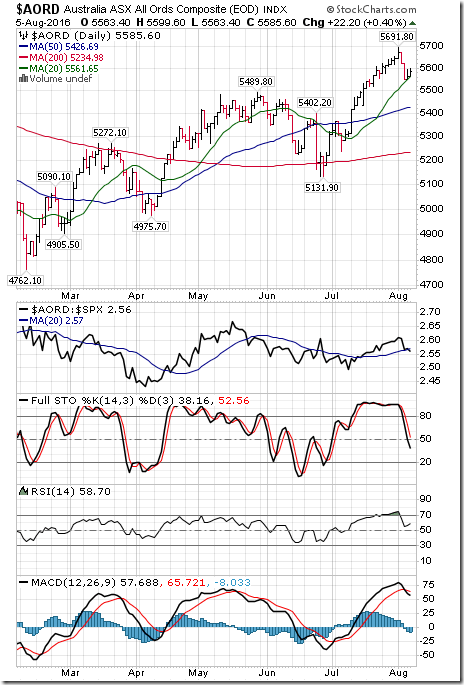
The Australia All Ordinaries Composite Index dropped 41.60 points (1.03%) last week. Intermediate trend remains up. Strength relative to the S&P 500 Index changed to neutral from positive. The Index remains intermediate overbought. Short term momentum indicators are trending down. Technical score dropped last week to 2 from 6.
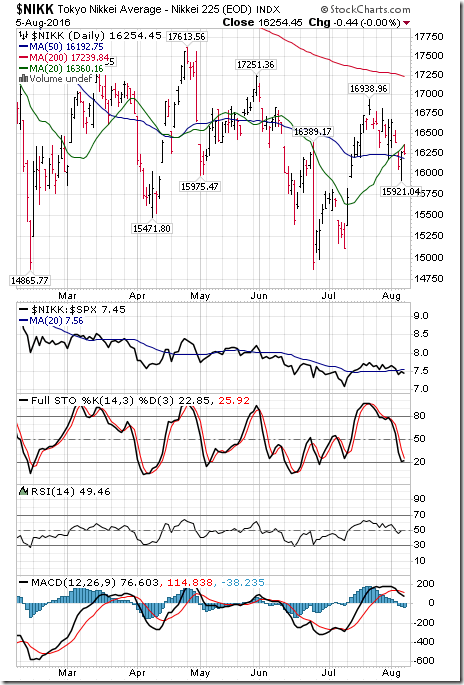
The Nikkei Average dropped 3124.82 points (1.90%) last week. Intermediate trend remains down. Strength relative to the S&P 500 Index remains neutral. The Average dropped below its 20 day moving average. Short term momentum indicators are trending down. Technical score dropped last week to -4 from -2.
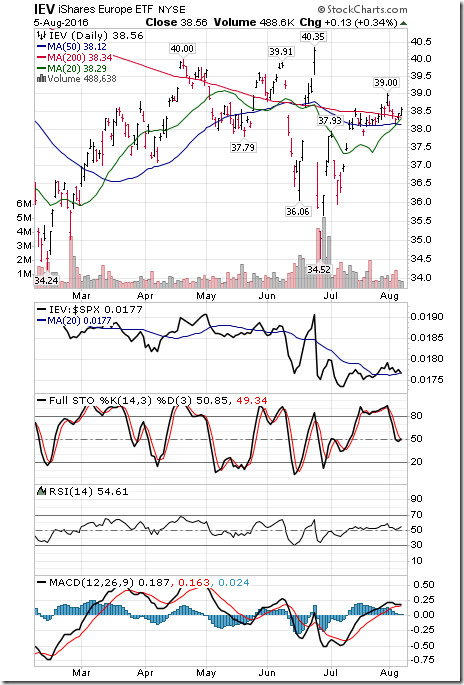
Europe iShares dropped $0.39 (1.00%) last week. Intermediate trend remains down. Strength relative to the S&P 500 Index remains positive. Units remained above their 20 day moving average. Short term momentum indicators are trending down. Technical score dipped last week to 0 from 2.
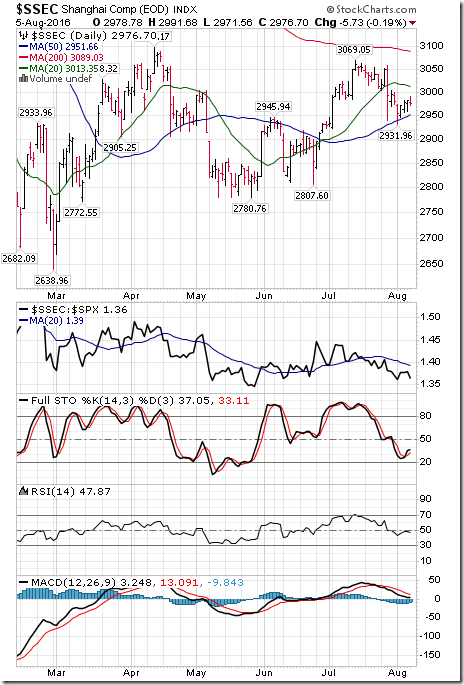
The Shanghai Composite Index dropped 2.64 points (0.09%) last week. Intermediate trend remains up. Strength relative to the S&P 500 Index remains negative. The Index remains below its 20 day moving average. Short term momentum indicators are trending down. Technical score remained at -2 last week.
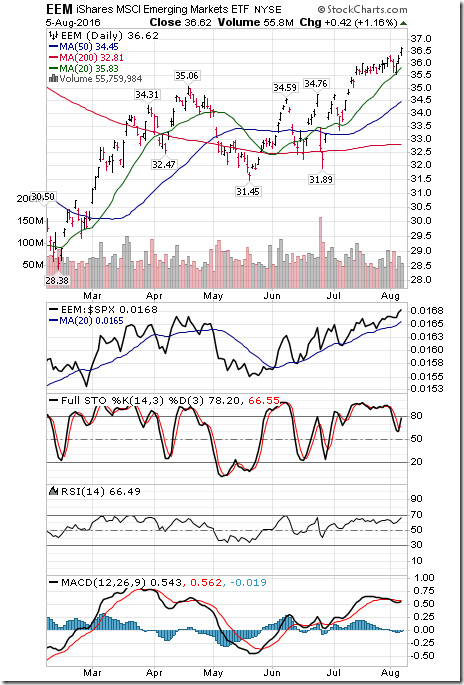
Emerging Markets iShares gained $0.41 (1.13%) last week. Intermediate trend remains up. Strength relative to the S&P 500 Index remains positive. Units remained above their 20 day moving average. Short term momentum indicators have rolled over from overbought levels. Technical score remained last week at 4.
Currencies
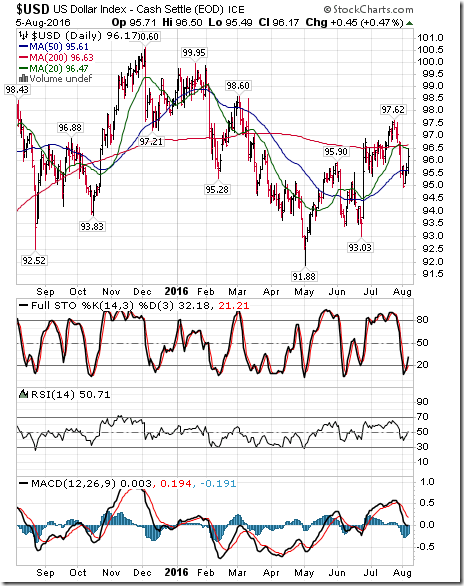
The U.S. Dollar Index gained 0.68 (0.71%) last week with most of the gain recorded on Friday following release of a better than expected July employment report. Intermediate trend remains up. The Index remains below its 20 day moving average. Short term momentum indicators are mixed.
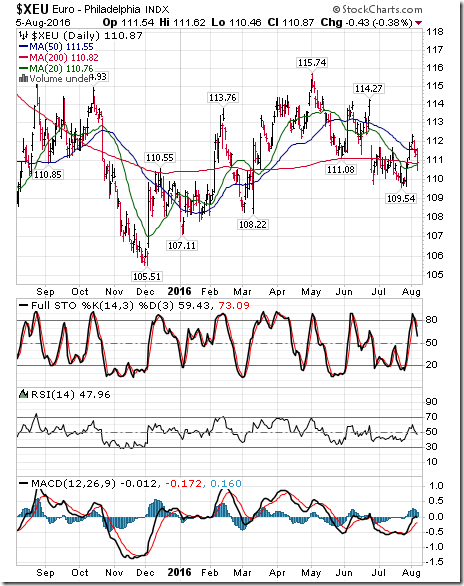
The Euro lost 0.97 (0.84%) last week. Intermediate trend remains neutral. The Euro remains above its 20 day moving average. Short term momentum indicators are mixed.
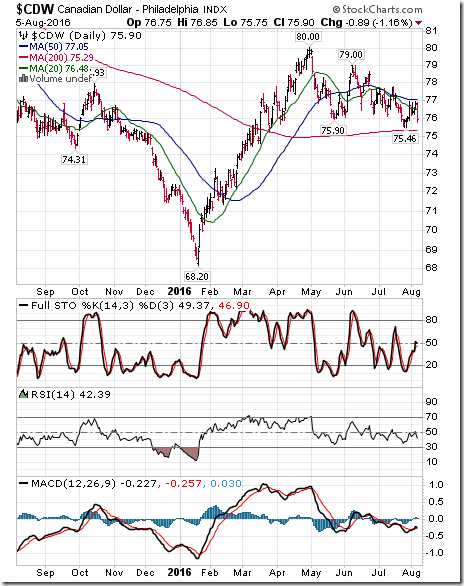
The Canadian Dollar dropped US 0.77 cents (1.00%) last week. Intermediate trend remains down. The Canuck buck dropped below its 20 day moving average on Friday. Short term momentum indicators are mixed.
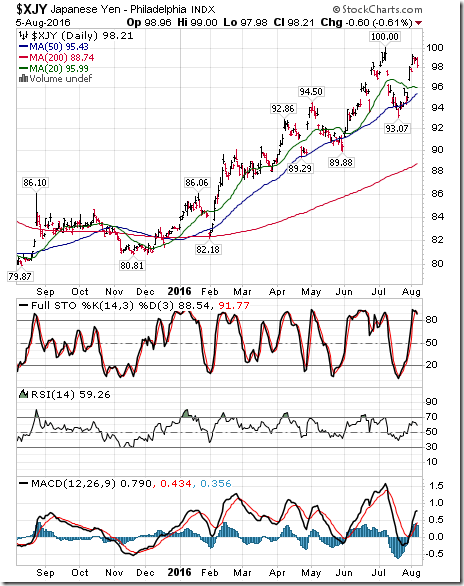
The Japanese Yen added 0.29 (0.30%) last week. Intermediate trend remains up. The Yen remains above its 20 day moving average. Short term momentum indicators are trending up.
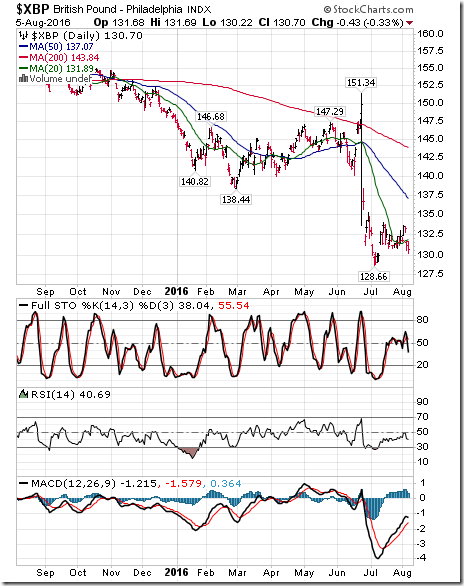
The British Pound lost 1.60 (1.21%) last week after the Bank of England lowered its overnight lending rate to 0.25% from 0.50%. Intermediate trend remains down. The Pound dropped below its 20 day moving average. Short term momentum indicators are mixed.
Commodities
Daily Seasonal/Technical Commodities Trends for August 5th 2016
Green: Increase from previous day
Red: Decrease from previous day
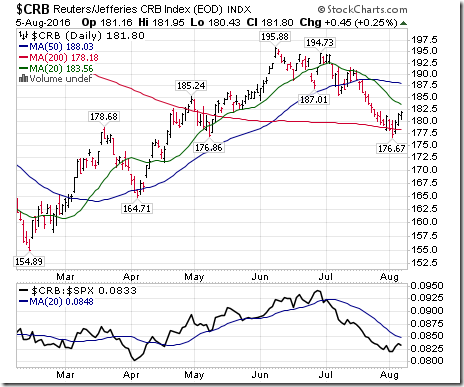
The CRB Index added 0.79 (0.44%) last week. Intermediate trend remains down. Strength relative to the S&P 500 Index remains negative. The Index remains below its 20 day moving average. Short term momentum indicators have started to trend up. Technical score improved last week to -4 from -6.
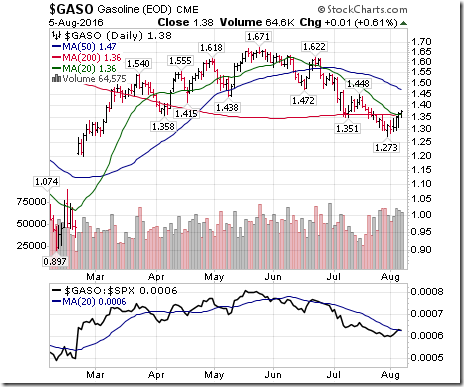
Gasoline added $0.06 per gallon (4.55%) last week. Intermediate trend remains down. Strength relative to the S&P 500 Index remains down. Gas moved above its 20 day moving average. Short term momentum indicators are trending up. Technical score improved last week to -2 from -.6.
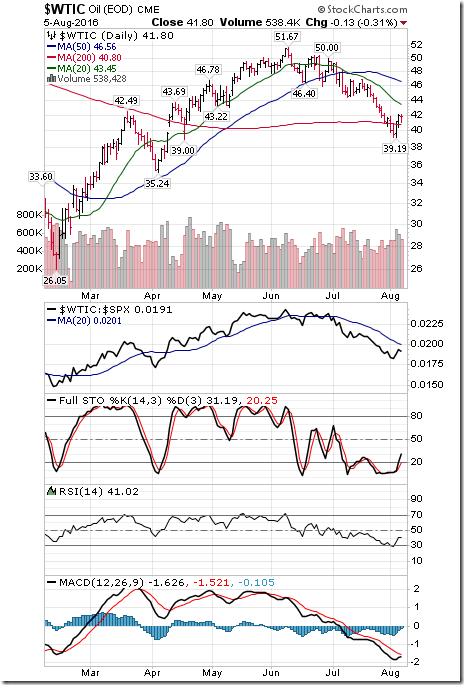
Crude oil added $0.20 per barrel (0.48%) last week. Intermediate trend remains up. Strength relative to the S&P 500 Index remained negative. Crude remains below its 20 day moving average. Short term momentum indicators have turned higher. Technical score improved last week to 0 from 2.
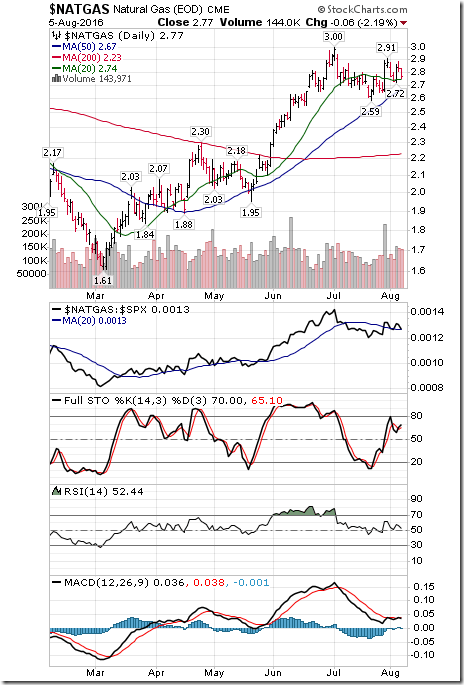
Natural gas dropped $0.11 per MBtu (3.82%) last week. Intermediate trend remains up. Strength relative to the S&P 500 Index remained neutral. “Natty” remained above its 20 day moving average. Short term momentum indicators are trending up. Technical score remained last week at 4.
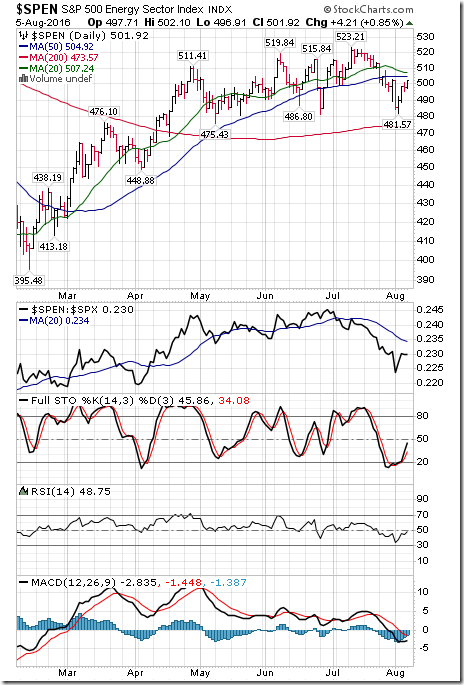
The S&P Energy Index slipped 0.31 (0.06%) last week. Intermediate trend remains neutral. Strength relative to the S&P 500 Index remained negative. The Index remained below its 20 day moving average. Short term momentum indicators have turned higher. Technical score improved last week to 0 from -2.
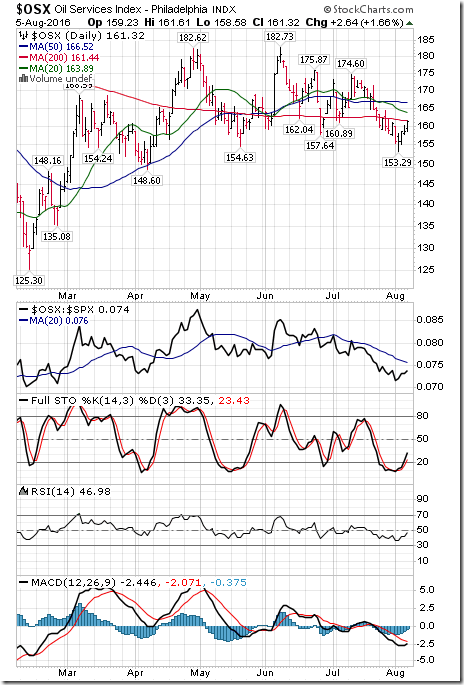
The Philadelphia Oil Services Index added $0.48 (2.98%) last week. Intermediate trend remains down. Strength relative to the S&P 500 Index remains negative. The Index remains below its 20 day moving average. Short term momentum indicators have turned higher. Technical score improved last week to -4.
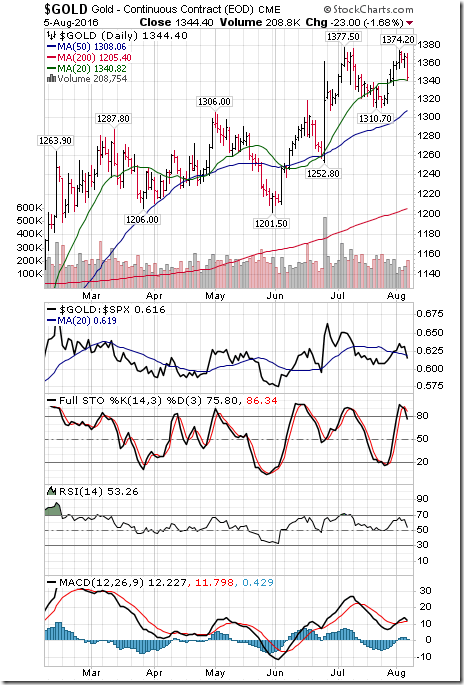
Gold slipped $13.10 per ounce (0.97%) last week. Intermediate trend remains up. Strength relative to the S&P 500 Index remained neutral. Gold remains above its 20 day moving average. Short term momentum indicators turned lower on Friday. Technical score slipped last week to 2 from 4.
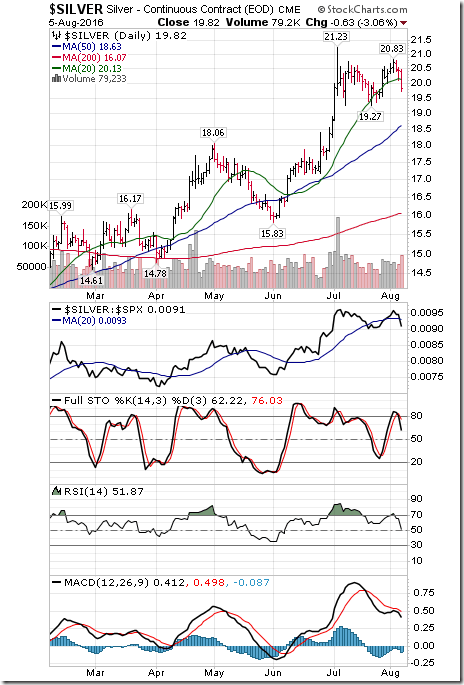
Silver dropped $0.53 per ounce (2.60%) last week. Intermediate trend remains up. Strength relative to the S&P 500 Index changed to neutral from positive on Friday. Silver dropped below its 20 day moving average on Friday. Short term momentum indicators have turned down. Technical score dropped last week to 0 from 4.
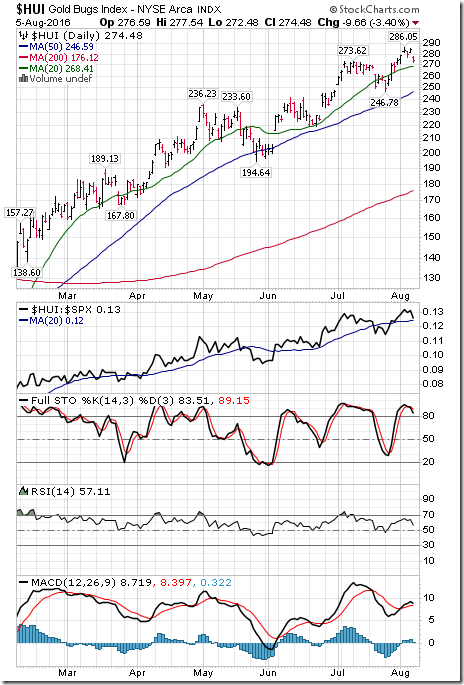
The AMEX Gold Bug Index added 0.16 (0.06%) last week. Intermediate trend remains up. Strength relative to the S&P 500 Index changed to positive from neutral. The Index remains above its 20 day moving average. Short term momentum indicators are trending up. Technical score improved last week to 6 from 4.
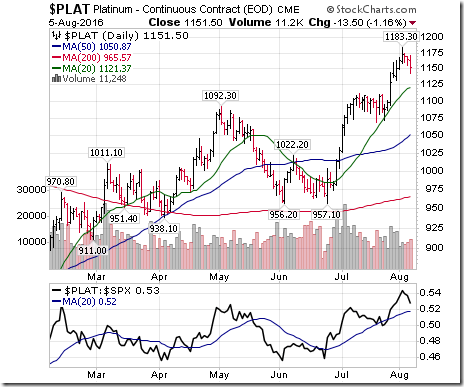
Platinum added $0.90 per ounce (0.08%) last week. Trend remains up. Relative strength remains positive. PLAT remained above its 20 day MA. Momentum has turned down. Score: 4
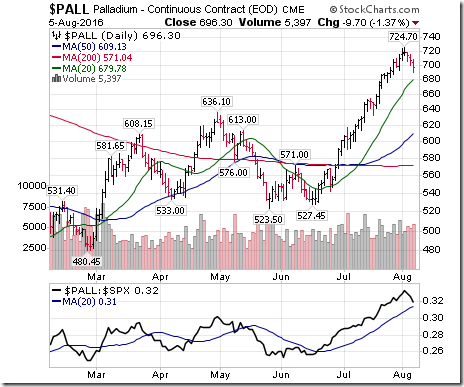
Palladium dropped $13.45 per ounce (1.90%) last week. Intermediate trend remains up. Strength relative to the S&P 500 Index remains positive. PALL remains above its 20 day moving average. Short term momentum indicators have turned down. Technical score slipped to 4 from 6
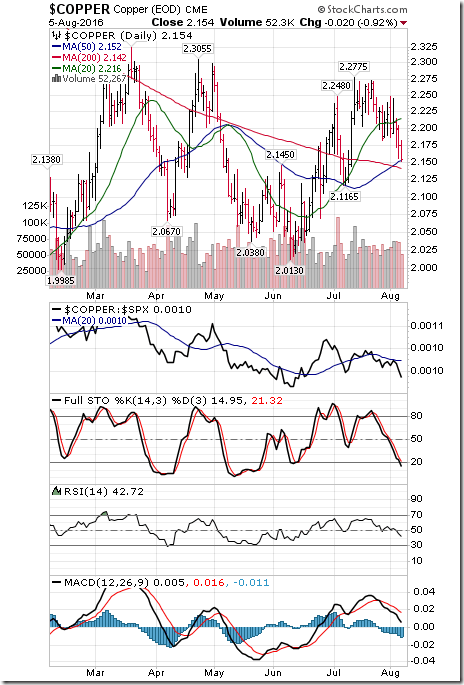
Copper dropped 0.067 cents per lb. (3.02%) last week. Intermediate trend remained neutral. Strength relative to the S&P 500 Index turned negative. Copper dropped below its 20 day moving average. Short term momentum indicators are trending down. Technical score dropped last week to -4 from 0.
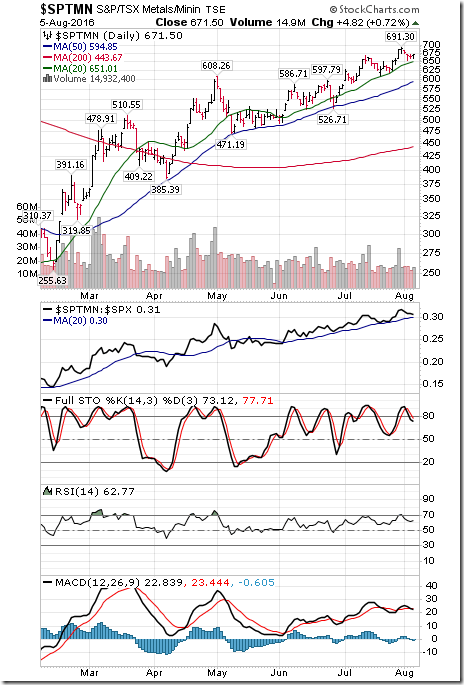
S&P Metal & Mining Index dropped 17.42 points (2.53%) last week. Intermediate trend remains up. Strength relative to the S&P 500 Index remains positive. The Index remains above its 20 day moving average. Short term momentum indicators have turned down. Technical score dropped last week to 4 from 6.
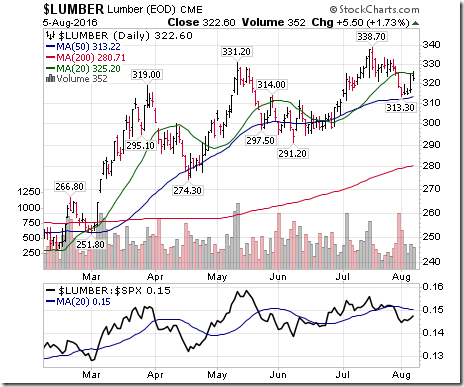
Lumber added 4.20 (1.32%) last week. Trend remained up. Relative strength remained negative. Lumber remained below its 20 day MA. Momentum has turned higher. Score: 0
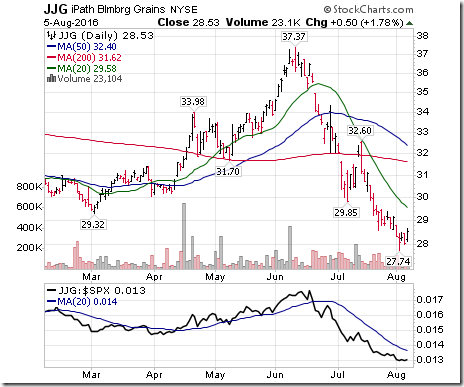
The Grain ETN dropped another $0.62 (2.13%) last week. Intermediate trend remains down. Strength relative to the S&P 500 Index remained negative. Units remained below their 20 day moving average. Short term momentum indicators have turned up. Score: -4
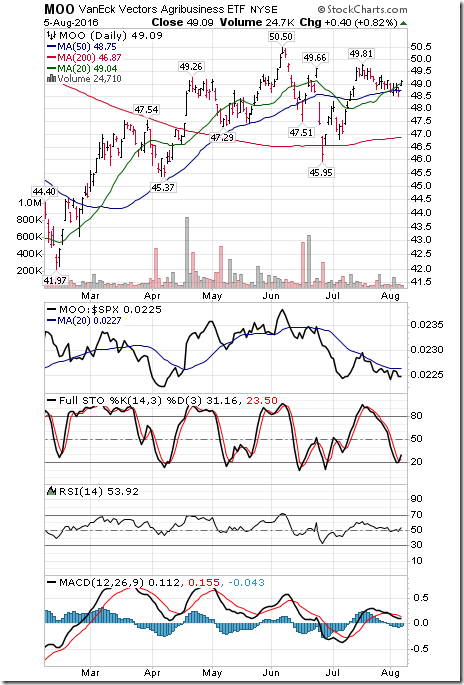
The Agriculture ETF slipped $0.04 (0.08%) last week. Intermediate trend remains neutral. Strength relative to the S&P 500 Index remained negative. Units remained above their 20 day moving average. Short term momentum indicators are trending down. Technical score remained last week at -2
Interest Rates
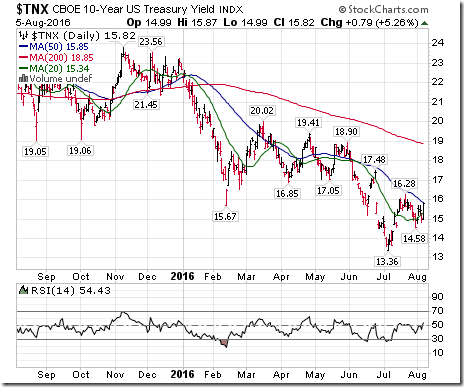
Yield on 10 year Treasuries jumped 12.4 basis points (8.50%) last week. Most of the gains occurring on Friday following news of the stronger than expected employment report. Intermediate trend remains down. Yield moved above its 20 day moving average. Short term momentum indicators have turned upward.
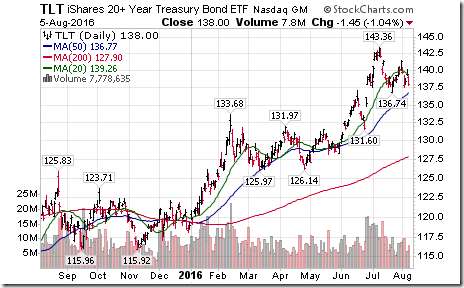
Conversely, price of the long term Treasury ETF dropped $3.56 (2.51%) last week. Intermediate trend remains up. Units fell below their 20 day moving average on Friday.
Volatility
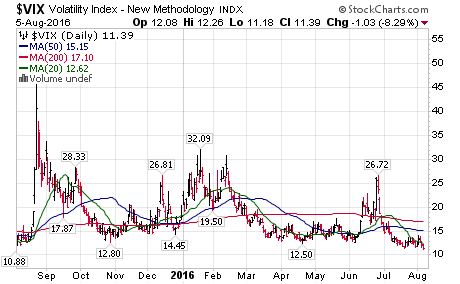
The VIX Index dipped 0.48 (4.04%) last week. Intermediate trend remains down. The Index remained below its 20 day moving average.
Sectors
Daily Seasonal/Technical Sector Trends for August 5th 2016
Green: Increase from previous day
Red: Decrease from previous day
Special Free Services available through www.equityclock.com
Equityclock.com is offering free access to a data base showing seasonal studies on individual stocks and sectors. The data base holds seasonality studies on over 1000 big and moderate cap securities and indices. To login, simply go to http://www.equityclock.com/charts. Following is an example:
StockTwits Released on Friday
Natural gas shows a rare summer draw down as summer heat fuels demand.
Technical action by S&P 500 stocks to 10:00 AM: Bullish. 17 S&P 500 stocks broke resistance
Most of the breakouts were financials: $AIG,$BLK,$C,$DFS,$FITB,$JPM,$KEY,$PGR,$PNC, $NAVI,$USB.$XFN hits 8 month high
Utilities break support on higher interest rates. Weakest sector this morning. $ED, $DUK, $ETR, $PNW
WALL STREET RAW RADIO WITH MARK LEIBOVIT
AND SPECIAL GUESTS SINCLAIR NOE AND HARRY BOXER – AUGUST 6, 2016: http://tinyurl.com/gmue6o3
Accountability Report
Shaw Communications ($20.22 US, $26.36 Cdn) was supported with Seasonality charts and price charts initially on June 24th at $19.66 U.S. and reiterated on July 27th at $25.17 Cdn for a seasonal trade to the end of July. At the end of its period of seasonal strength, Tech Talk watched for technical signs of deterioration. Those signs appeared last last week when short term momentum indicators rolled over from overbought levels and strength relative to the S&P 500 began to lag. The stock no longer is supported as a seasonal trade. Seasonal investors can take a small profit.
Disclaimer: Seasonality and technical ratings offered in this report by www.timingthemarket.ca and www.equityclock.com are for information only. They should not be considered as advice to purchase or to sell mentioned securities. Data offered in this report is believed to be accurate, but is not guaranteed
Copyright © DV Tech Talk, Timingthemarket.ca


![clip_image002[6] clip_image002[6]](https://advisoranalyst.com/wp-content/uploads/2019/08/7b6dcdded6a14ff2c2590a1a02ca0ce1.png)
![clip_image002[8] clip_image002[8]](https://advisoranalyst.com/wp-content/uploads/2019/08/cfa4e046eab717d3ade2f33a93bfaab2.png)
![clip_image002[10] clip_image002[10]](https://advisoranalyst.com/wp-content/uploads/2019/08/232ac3fe7b473e97773fabd54374c3ab.png)
