by Don Vialoux, Timingthemarket.ca
Economic News This Week
May Case/Shiller year-over-year 20 City Home Price Index to be released at 9:00 AM EDT on Tuesday is expected to be unchanged from April with a gain at 5.4%
July Consumer Confidence Index to be released at 10:00 AM EDT on Tuesday is expected to slip to 96.0 from 98.0 in June.
June New Home Sales to be released at 10:00 AM EDT on Tuesday are expected to rise to 560,000 from 551,000 in May.
June Durable Goods Orders to be released at 8:30 AM EDT on Wednesday are expected to decline 1.0% versus a drop of 2.2% in May. Excluding Transportation, Orders are expected to increase 0.2% versus a decline of 0.3% in May.
FOMC Meeting results to be released at 2:00 PM EDT on Wednesday are expected to maintain the Fed Fund rate at 0.25-0.50%.
Weekly Initial Jobless Claims to be released at 8:30 AM EDT on Thursday are expected to increase to 260,000 from 253,000 last week.
Advanced second quarter GDP to be released at 8:30 AM EDT on Friday is expected to grow at a 2.6% annual rate versus growth at a 1.1% in the first quarter.
Canadian May Real GDP to be released at 8:30 AM EDT on Friday is expected to drop 0.5% versus a gain of 0.1% in April.
July Chicago PMI to be released at 9:45 AM EDT on Friday is expected to slip to 54.0 from 56.8 in June.
July Michigan Sentiment Index to be released at 10:00 AM EDT on Friday is expected to dip to 90.4 from 93.5 in June.
Earnings Reports This Week
The Bottom Line
Technical, seasonal and fundamental factors point to a strong possibility of start of an intermediate correction by equity markets and economic sensitive sectors. Traders and seasonal investors should respond accordingly.
Observations
Historically, an unexpected event (e.g. China blowing up last summer, Ebola and Ukraine incidents in 2014, Greece blowing up in 2013) has occurred between the middle of June and the middle of October that triggered a significant increase in equity market volatility (and a corresponding correction). The event(s) that will trigger the volatility this summer is not clear. One possibility is increased terrorist activity.
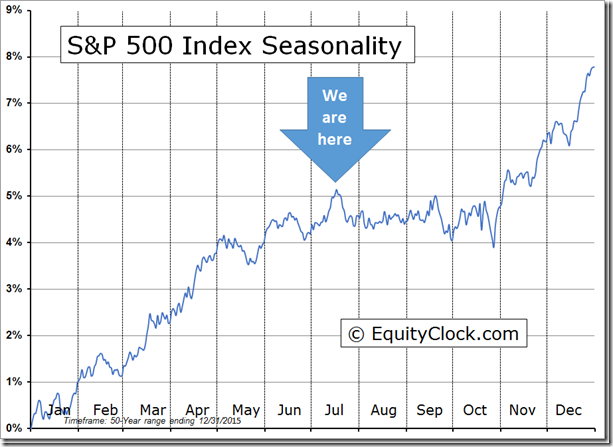
On average during the past 50 years, the S&P 500 Index has reached a seasonal summer peak on July 17th
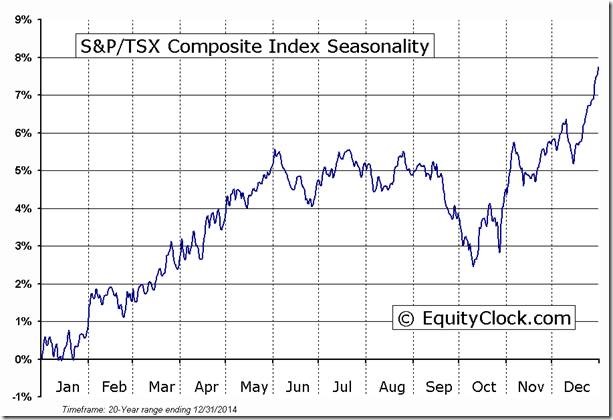
On average during the past 20 years, the TSX Composite has reached a summer peak on July 17th
Economic focus this week is on the FOMC meeting on Tuesday and Wednesday. Consensus is calling for no change in the Fed Fund rate currently at 0.25%-0.50%.
Other economic reports this week are expected to be mixed at best.
Responses to second quarter reports have been mixed. 125 S&P 500 companies have reported to date. 68% have reported higher than consensus earnings and 57% have reported higher than consensus revenues. Blended earnings are down 3.7% on a year-over-year basis while blended revenues are down 0.3%. 14 S&P 500 companies issued negative third quarter guidance with their second quarter report while 5 companies have issued positive guidance.
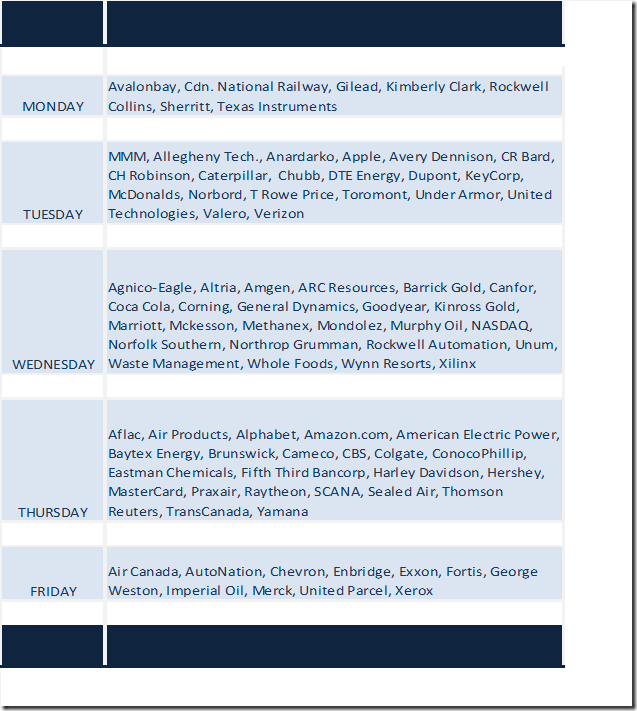
This week is the big week for second quarter reports. 203 S&P 500 companies are scheduled to report (including 12 Dow Jones Industrial Average stocks).
Analysts continue to lower third and fourth quarter earnings estimates. According to FactSet, consensus estimates for earnings by S&P 500 companies dropped last week from 0.4% to -0.1% in the third quarter and to 6.9% to 6.6% in the fourth quarter.
Earnings reports by major Canadian companies will start to dribble in this week. Next week is the big week for Canadian companies.
Short and intermediate technical indicators for most equity market indices and economic sensitive sectors remain overbought, but have yet to show significant signs of a peak.
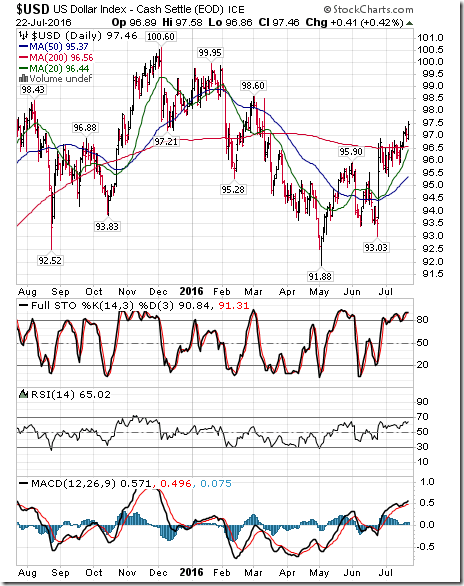
Strength in the U.S. Dollar Index is having a negative impact on a variety of markets, most notably other currencies, commodities and commodity sensitive equities. Ultimately, strength in the U.S. Dollar index will dampen earnings prospects for major international companies with a U.S. base.
Evidence of a bottom in U.S. Treasury yields continues to build. Comments by the Federal Reserve on Wednesday will give a better picture on when the next increase in the Fed Fund rate will occur and when treasury prices will continue to move lower. Favourable recent economic data points during the past 2-3 weeks imply a more “hawkish” comment to be released on Wednesday along with no change in the Fed Fund rate this time. The Federal Reserve probably would like to avoid an increase on September 21st and November 2nd prior to the U.S. Presidential election, implying likelihood for the next increase in the Fed Fund rate in mid-December.
Equity Indices and Related ETFs
Daily Seasonal/Technical Equity Trends for July 22nd 2016
Green: Increase from previous day
Red: Decrease from previous day
Calculating Technical Scores
Technical scores are calculated as follows:
Intermediate Uptrend based on at least 20 trading days: Score 2
Higher highs and higher lows
Intermediate Neutral trend: Score 0
Not up or down
Intermediate Downtrend: Score -2
Lower highs and lower lows
Outperformance relative to the S&P 500 Index: Score: 2
Neutral Performance relative to the S&P 500 Index: 0
Underperformance relative to the S&P 500 Index: Score -2
Above 20 day moving average: Score 1
At 20 day moving average: Score: 0
Below 20 day moving average: -1
Up trending momentum indicators (Daily Stochastics, RSI and MACD): 1
Mixed momentum indicators: 0
Down trending momentum indicators: -1
Technical scores range from -6 to +6. Technical buy signals based on the above guidelines start when a security advances to at least 0.0, but preferably 2.0 or higher. Technical sell/short signals start when a security descends to 0, but preferably -2.0 or lower.
Long positions require maintaining a technical score of -2.0 or higher. Conversely, a short position requires maintaining a technical score of +2.0 or lower.
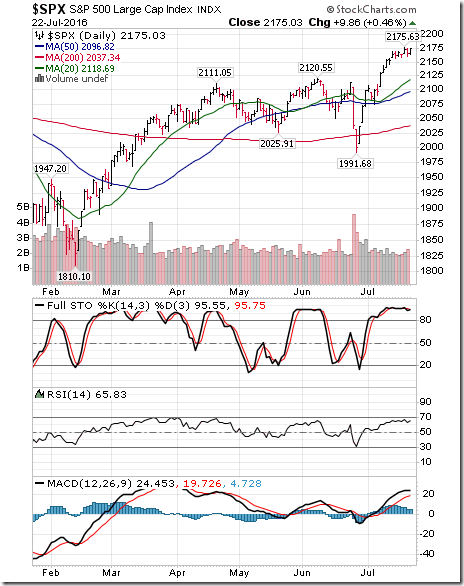
The S&P 500 Index gained 13.29 points (0.61%) last week. Intermediate trend remains up with the Index closing at an all-time high. The Index remains above its 20 day moving average. Short term momentum indicators are trending up, are overbought and showing early signs of peaking.
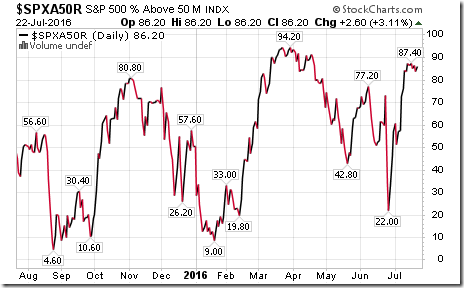
Percent of S&P 500 stocks trading above their 50 day moving average (Also known as the S&P 500 Momentum Barometer) slipped last week to 86.20% from 86.60%. Percent is intermediate overbought and showing early signs of rolling over.
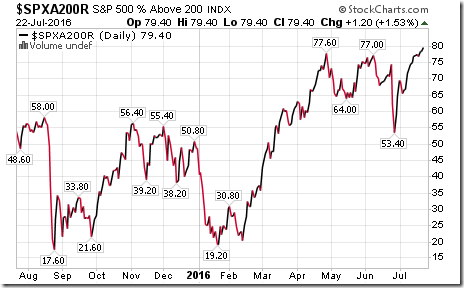
Percent of S&P 500 stocks trading above their 200 day moving average increased last week to 79.40% from 77.00%. Percent remains intermediate overbought, but has yet to show signs of peaking.
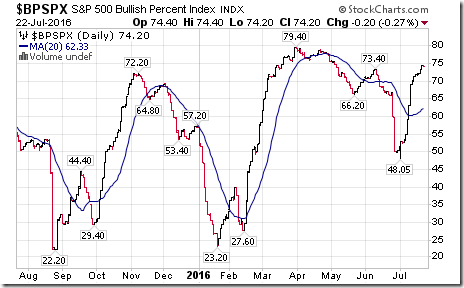
Bullish Percent Index for S&P 500 stocks increased last week to 74.20% from 71.80% and remained above its 20 day moving average. The Index remains intermediate overbought, but has yet to show signs of peaking.
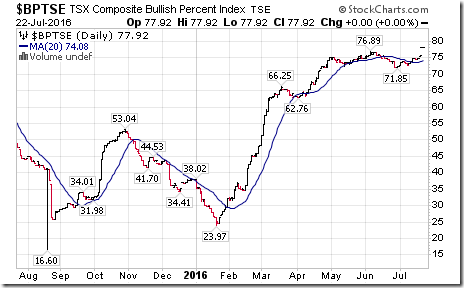
Bullish Percent Index for TSX Composite stocks increased last week to 77.92% from 74.37% and remained above its 20 day moving average. The Index remains intermediate overbought, but has yet to show signs of peaking.
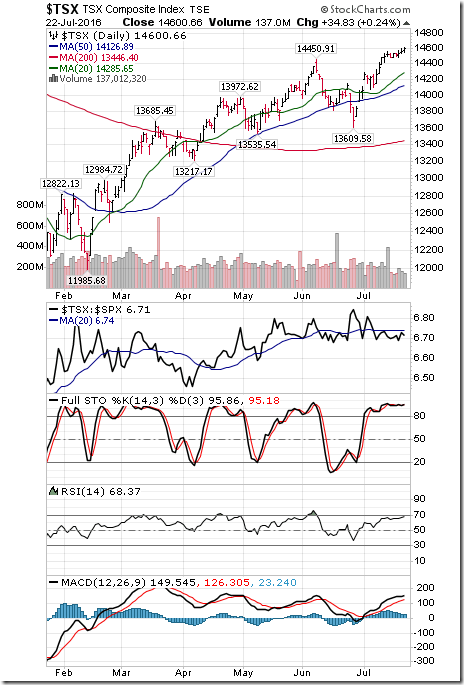
The TSX Composite Index added 118.24 points (0.82%) last week. Intermediate trend remains up (Score: 2). Strength relative to the S&P 500 Index remained neutral (Score: 0). The Index remains above its 20 day moving average (Score: 1). Short term momentum indicators are trending up (Score: 1), are overbought and showing early signs of peaking. Technical score remained at 4
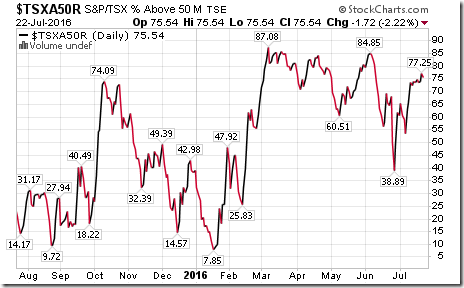
Percent of TSX stocks trading above their 50 day moving average (Also known as the TSX Composite Momentum Barometer) increased last week to 75.54% from 73.71%. Percent remains intermediate overbought, but has yet to show signs of peaking.
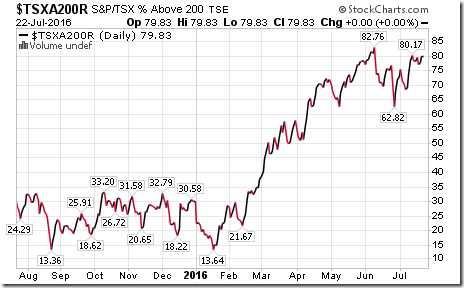
Percent of TSX stocks trading above their 200 day moving average increased last week to 79.83% from 78.02%. Percent remains intermediate overbought.
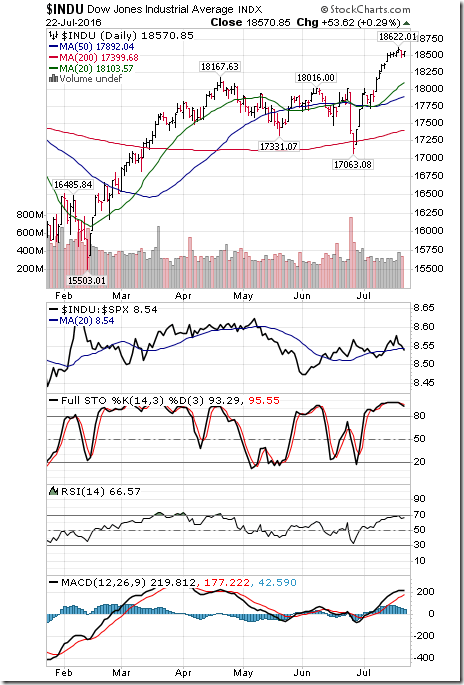
The Dow Jones Industrial Average gained 54.30 points (0.29%) last week. Intermediate trend remains up. Strength relative to the S&P 500 Index remained positive. The Average remained above its 20 day moving average. Short term momentum indicators are trending up, are overbought and showing early signs of peaking. Technical score remained at 6
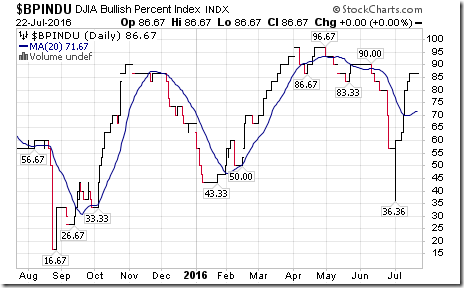
Bullish Percent Index for Dow Jones Industrial Average stocks remained unchanged last week at 86.67% and remained above its 20 day moving average. The Index remains intermediate overbought.
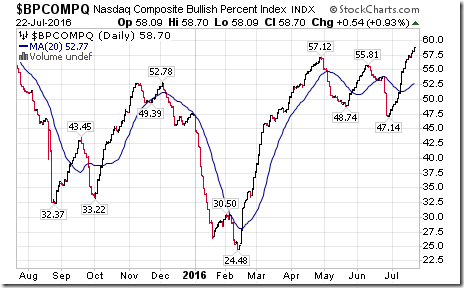
Bullish Percent Index for NASDAQ Composite Index increased last week to 58.70% from 56.81% and remained above its 20 day moving average. The Index remains intermediate overbought.
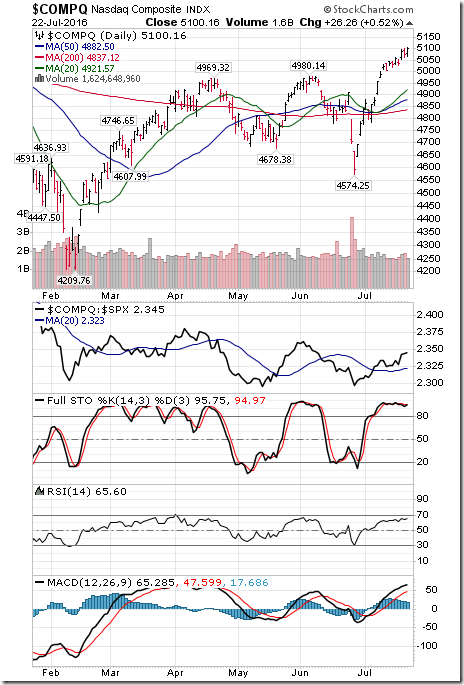
The NASDAQ Composite Index added 70.57 points (1.40%) last week. Intermediate trend remains up. Strength relative to the S&P 500 Index remains positive. The Index remains above its 20 day moving average. Short term momentum indicators are trending up, are overbought and showing early signs of peaking. Technical score remained at 6
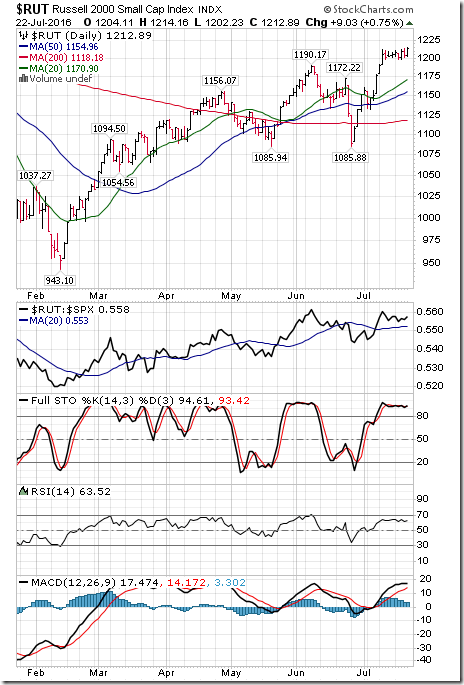
The Russell 2000 Index added 7.58 points (0.63%) last week. Intermediate trend remains up. Strength relative to the S&P 500 Index remained positive. The Index remained above its 20 day moving average. Short term momentum indicators are trending up, are overbought and showing early signs of peaking.
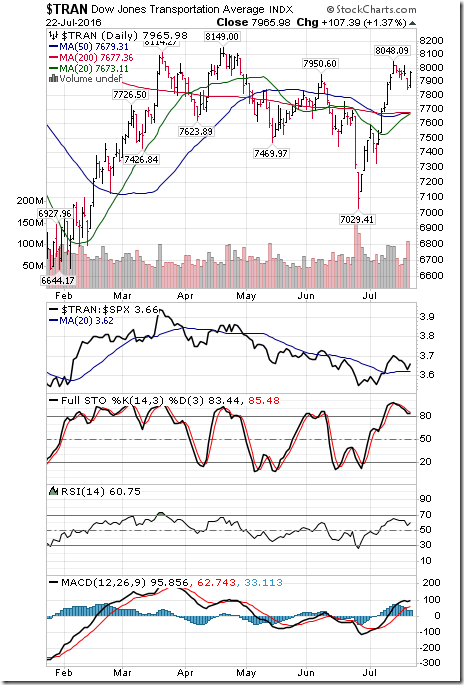
The Dow Jones Transportation Average slipped 19.19 points (0.40%) last week. Intermediate trend remained neutral. Strength relative to the S&P 500 Index remained positive. The Average remained above its 20 day moving average. Short term momentum indicators have rolled over from overbought levels. Technical score dipped last week to 2 from 4
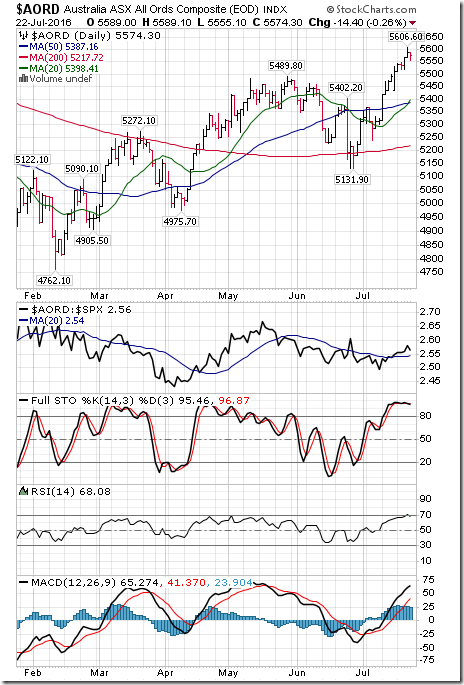
The Australia All Ordinaries Composite Index added 64.20 points (1.17%) last week. Intermediate trend remains up. Strength relative to the S&P 500 Index remains neutral. The Index remains above its 20 day moving average. Short term momentum indicators are trending up, are overbought and showing early signs of peaking. Technical score remained last week at 4.
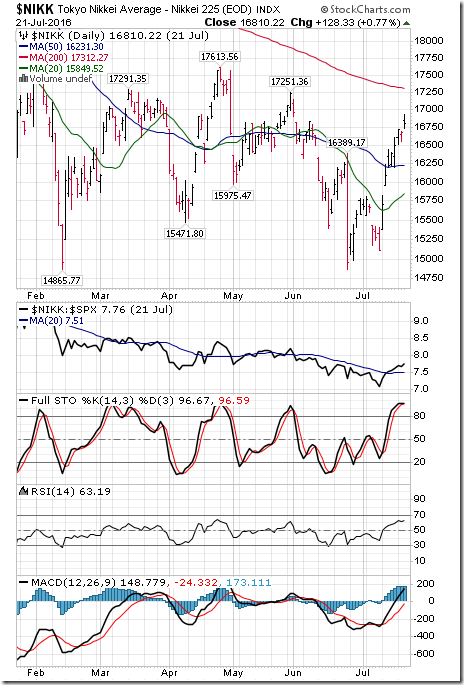
The Nikkei Average gained 312.37 points (1.89%) last week. Intermediate trend remains down. Strength relative to the S&P 500 Index remained neutral. The Average remained above its 20 day moving average. Short term momentum indicators are trending up and are overbought, but have yet to show signs of peaking.
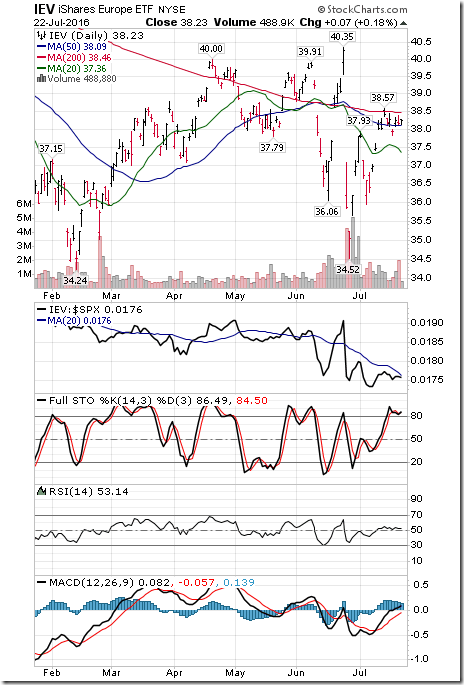
Europe iShares added 0.04 (0.10%) last week. Intermediate trend remains down. Strength relative to the S&P 500 Index remained negative. Units remained above its 20 day moving average. Short term momentum indicators are trending up, are overbought and showing early signs of peaking. Technical score remained last week at -2
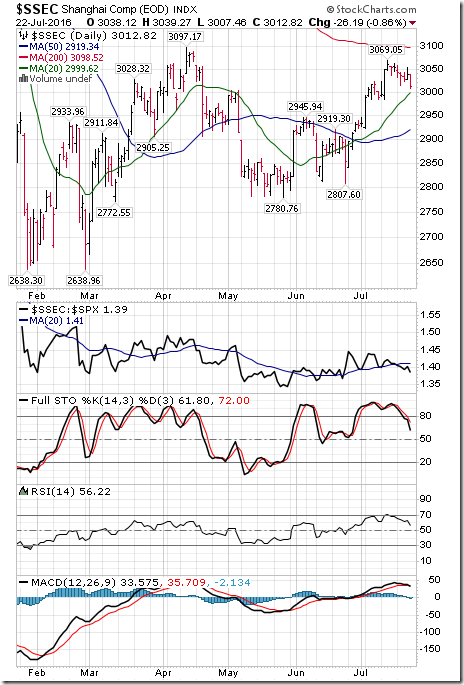
The Shanghai Composite Index slipped 41.48 points (1.36%) last week. Intermediate trend remains up. Strength relative to the S&P 500 Index changed last week to neutral from positive. The Index remained above its 20 day moving average. Short term momentum indicators have rolled over and are trending down. Technical score dropped last week to 2 from 6.
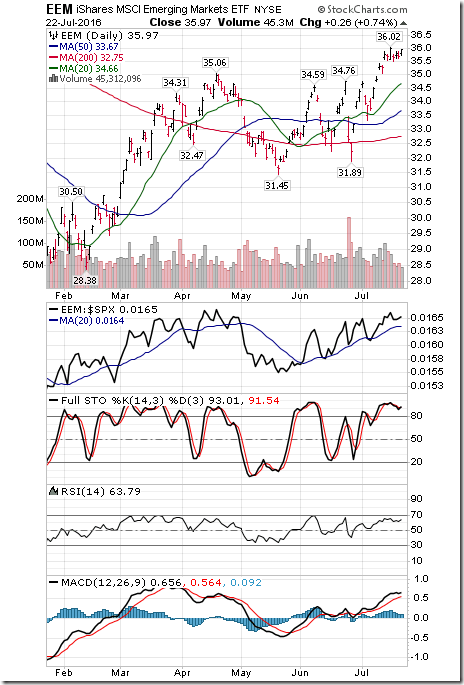
Emerging Markets iShares added $0.28 (0.78%) last week. Intermediate trend remains up. Strength relative to the S&P 500 Index remained positive. Units remained above their 20 day moving average. Short term momentum indicators are trending up, are overbought and showing early signs of peaking.
Currencies
The U.S. Dollar Index jumped 0.95 (0.98%) last week. Intermediate uptrend was confirmed on a move above 96.86. The Index remains above its 20 day moving average. Short term momentum indicators are overbought.
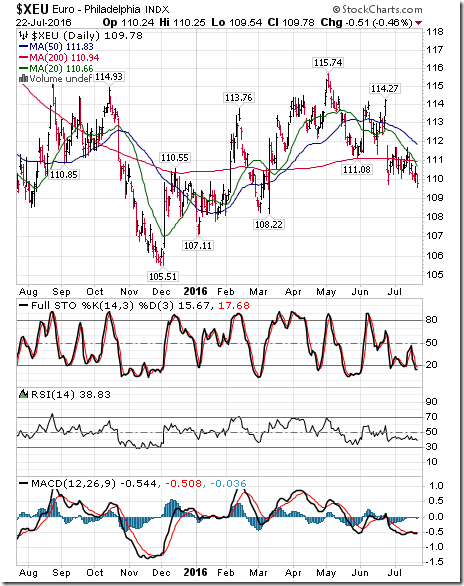
The Euro dropped 0.88(0.80%) last week. Intermediate downtrend was confirmed on a move below 109.71 on Friday. The Euro remains below its 20 day moving average. Short term momentum indicators are trending down and are oversold.
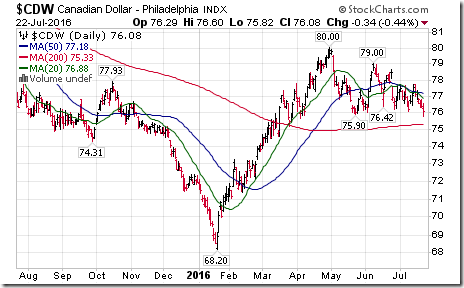
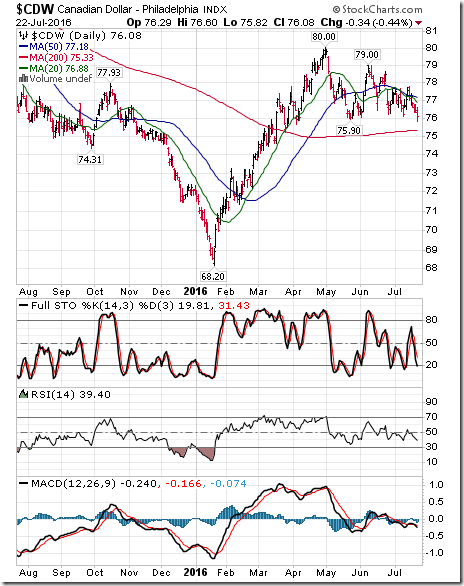
The Canadian Dollar dropped US 1.20 to 76.08 cents (1.55%) last week. Intermediate trend changed to down from up on Friday on a move below 75.90 on Friday. The Canuck Buck remains below its 20 day moving average. Short term momentum indicators are trending down.
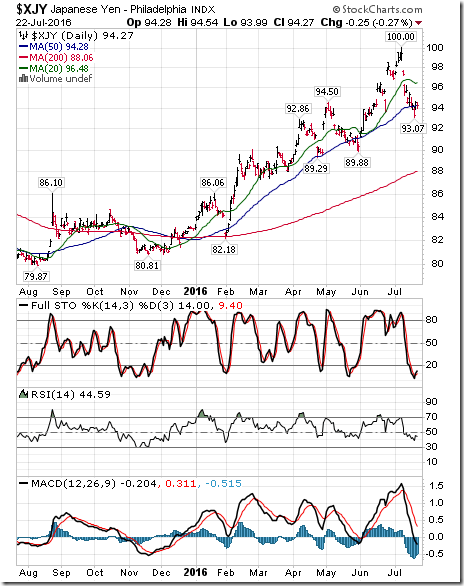
The Japanese Yen dropped 0.61 (0.64%) last week. Intermediate trend remains up. The Yen remained below its 20 day moving average. Short term momentum indicators are trending down and are oversold.
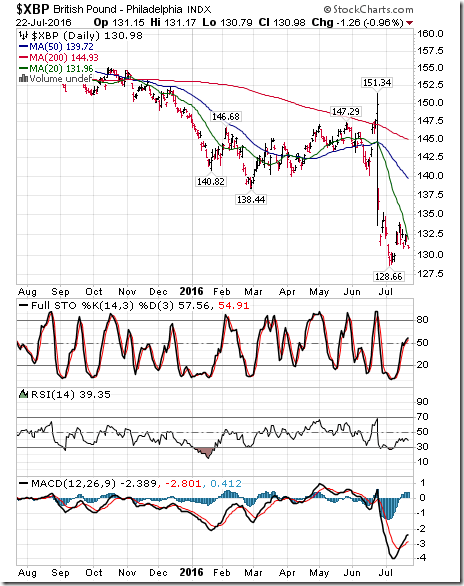
The British Pound dropped 1.20 (0.90%) last week. Intermediate trend remains down. The Pound remains below its 20 day moving average. Short term momentum indicators are trending up.
Commodities
Daily Seasonal/Technical Commodities Trends for July 22nd 2016
Green: Increase from previous day
Red: Decrease from previous day
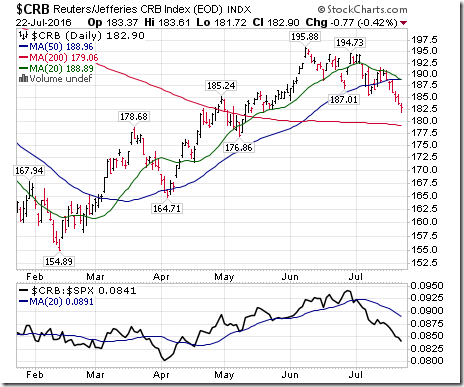
The CRB Index dropped 7.14 points (3.78%) in response to strength in the U.S. Dollar Index. Intermediate trend remains down. Strength relative to the S&P 500 Index remains negative. The Index remains below its 20 day moving average. Short term momentum indicators are trending down. Technical score last week dropped to -6 from -4.
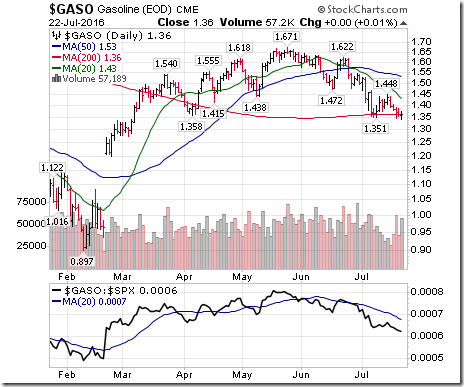
Gasoline dropped $0.07 per gallon (4.90%) last week. Intermediate trend remains down. Strength relative to the S&P 500 Index remains negative. Gas remained below its 20 day moving average. Short term momentum indicators are trending down. Technical score slipped last week to -6 from -4.
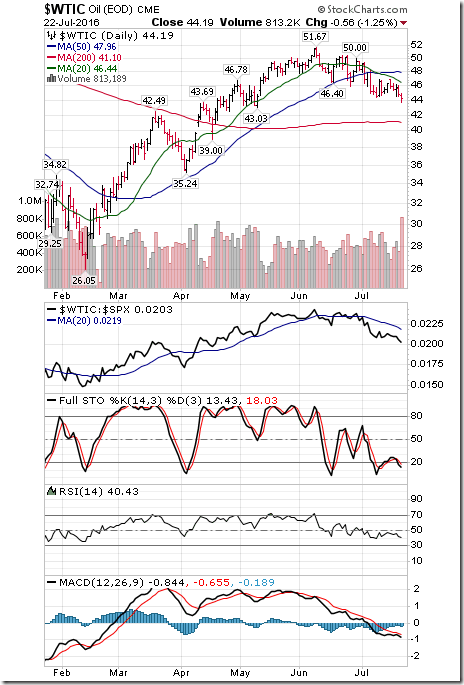
Crude Oil dropped $2.46 per barrel (5.27%) last week. Intermediate trend remains up. Strength relative to the S&P 500 Index remained negative. Crude remained below its 20 day moving average. Trend for short term momentum indicators have returned to down. Technical score dropped last week to -2 from 0.
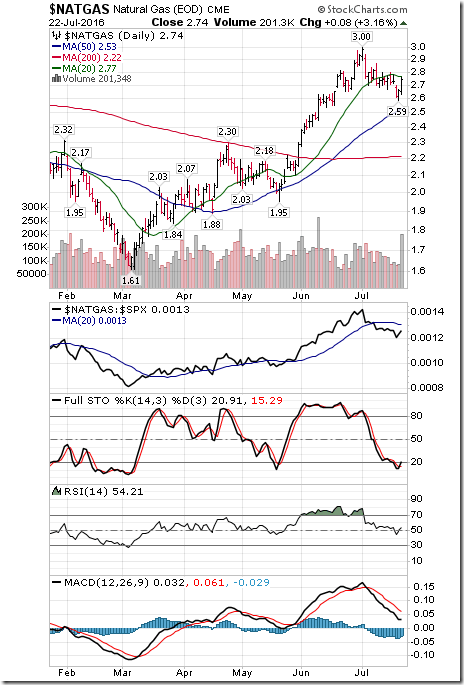
Natural Gas slipped $0.01 per MBtu (0.36%) last week. Intermediate trend remains up. Strength relative to the S&P 500 Index remained negative. “Natty” remained below its 20 day moving average. Short term momentum indicators are trending down and overbought, but showing early signs of bottoming. Technical score remained last week at -2.
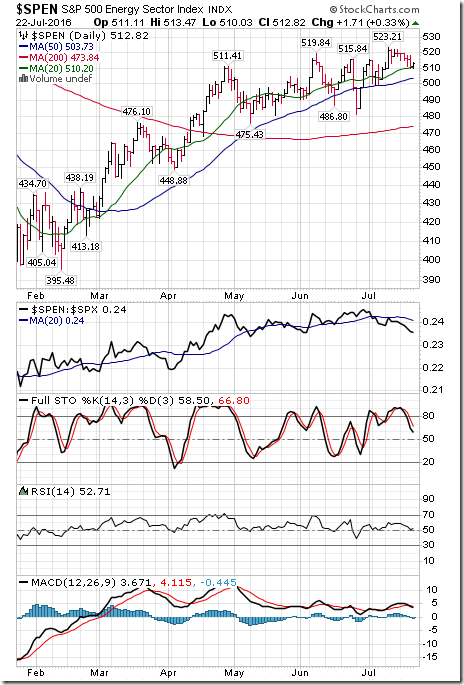
The S&P Energy Index dropped 6.80 points (1.31%) last week. Intermediate trend remains up. Strength relative to the S&P 500 Index remains negative. The Index remains above its 20 day moving average. Short term momentum indicators have turned down. Technical score slipped last week to 0 from 2.
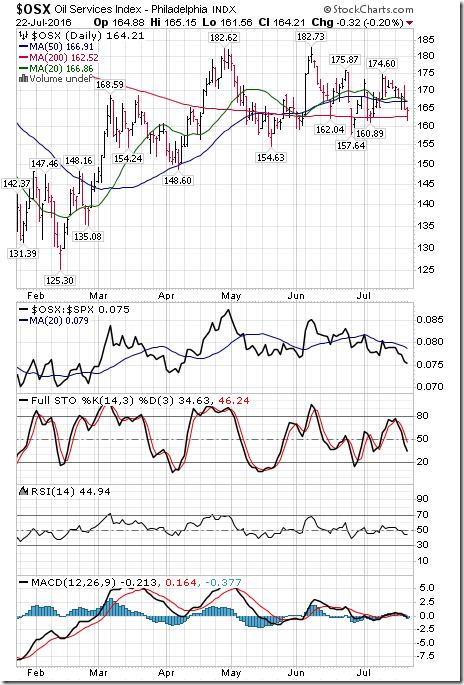
The Philadelphia Oil Services Index dropped 6.74 points (3.94%) last week. Intermediate trend remains up. Strength relative to the S&P 500 Index remains negative. The Index dropped below its 20 day moving average. Short term momentum indicators have turned down. Technical score dropped last week to -2 from 2.
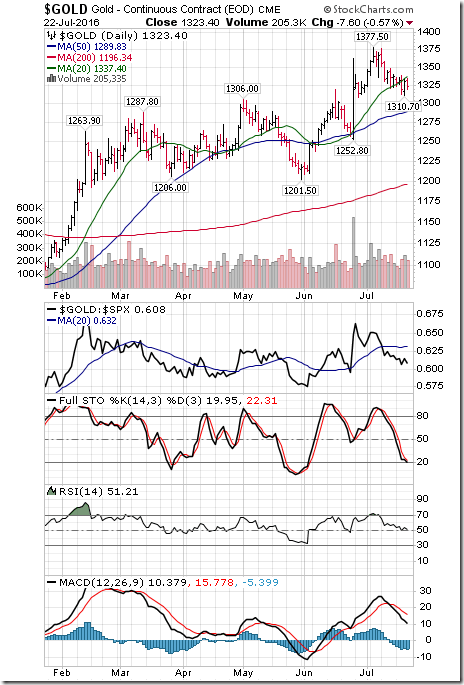
Gold dropped $4.00 per ounce (0.30%) last week. Intermediate trend remains up. Strength relative to the S&P 500 Index changed to negative from neutral. Gold dropped below its 20 day moving average. Short term momentum indicators are trending down. Technical score dropped last week to -2 from 2
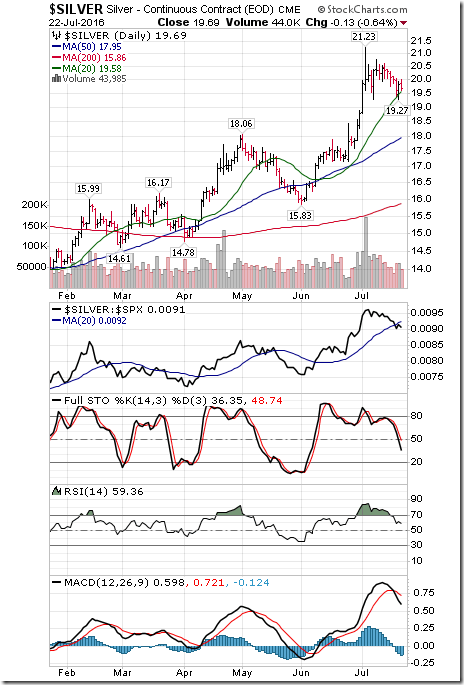
Silver dropped $0.48 per ounce (2.38%) last week. Intermediate trend remains up. Strength relative to the S&P 500 Index remains neutral. Silver remains above its 20 day moving average. Short term momentum indicators are trending down. Technical score dropped last week to 2 from 4. Strength relative to gold remains positive.
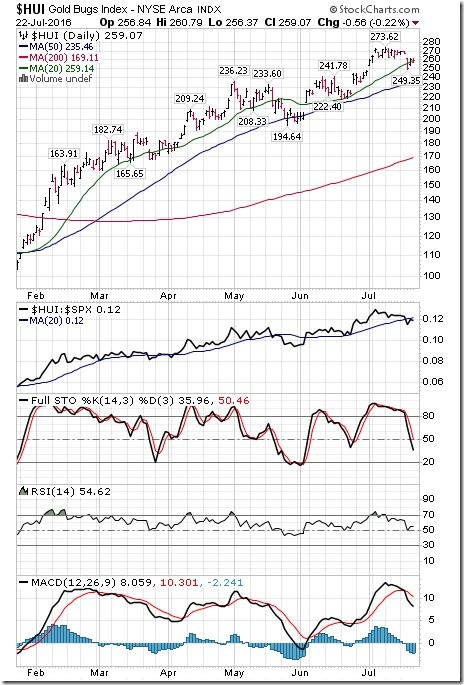
The AMEX Gold Bug Index dropped 8.67 points (3.24%) last week. Intermediate trend remains up. Strength relative to the S&P 500 Index changed to neutral from positive. The Index dropped below its 20 day moving average on Friday. Short term momentum indicators are trending down. Technical score dropped last week to 4 from 0.
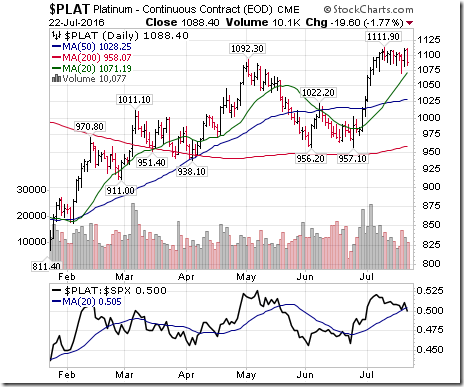
Platinum dropped $6.00 per ounce (0.55%) last week. Intermediate trend remains up. Relative strength turned neutral. PLAT remains above its 20 day MA. Momentum turned down.
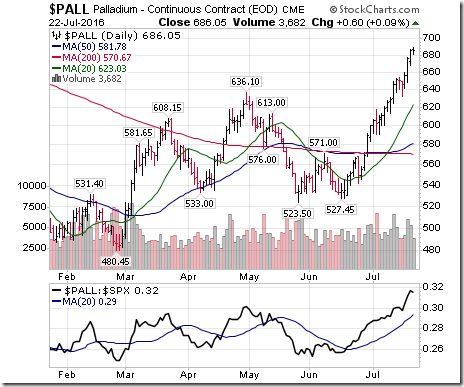
Palladium added $38.65 per ounce (5.97%) last week. Intermediate trend remains up. Strength relative to the S&P 500 Index and Gold remains positive. The Index remains above its 20 day moving average. Short term momentum indicators are trending up. Score remains at 6.
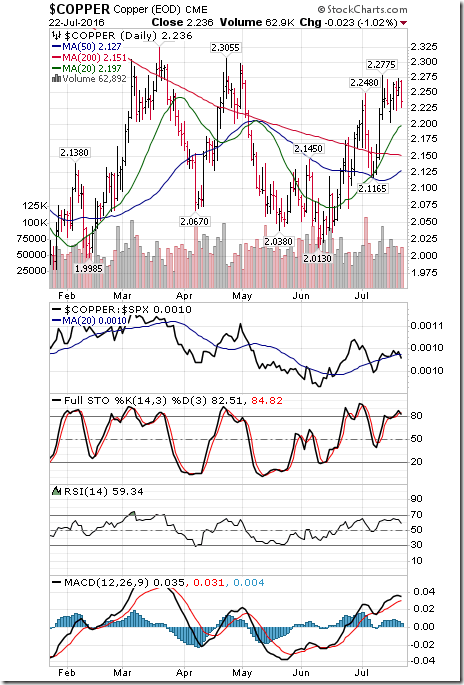
Copper added 0.02 cents (0.09%) last week. Intermediate trend remains neutral. Strength relative to the S&P 500 Index remains neutral. Copper remains above its 20 day moving average. Short term momentum indicators are trending up, but are overbought and showing early signs of peaking. Technical score remained last week at 2.
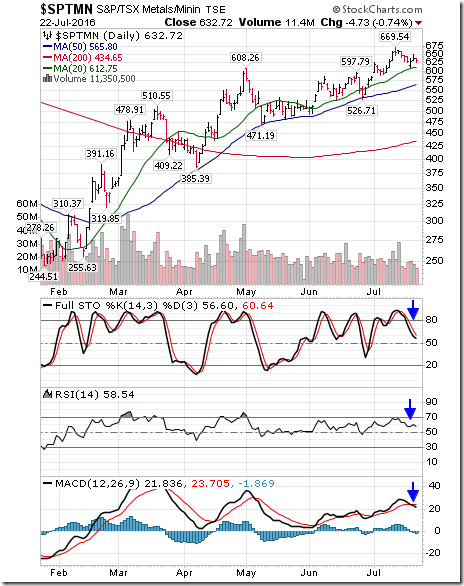
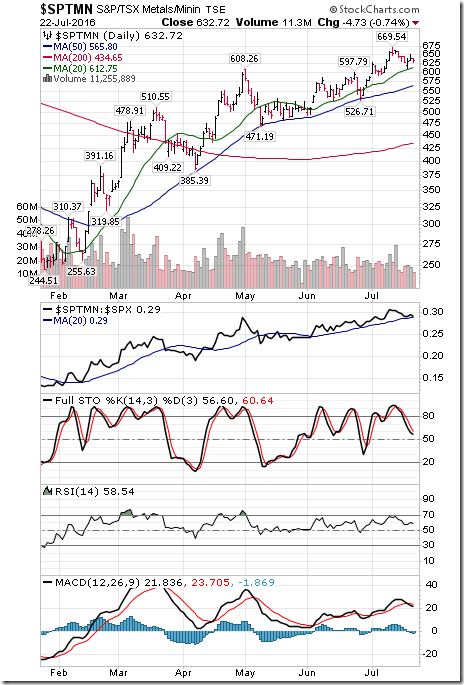
The S&P Metals & Mining Index dropped 12.94 points (2.00%) last week. Intermediate trend remains up. Strength relative to the S&P 500 Index remains positive. The Index remains above its 20 day moving average. Short term momentum indicators have turned down. Technical score slipped last week to 4 from 6.
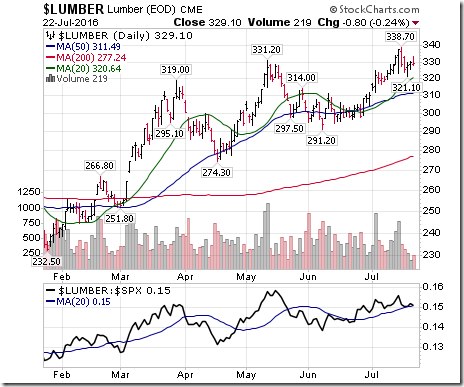
Lumber dropped 7.10 (2.11%) last week. Trend remains up. Relative strength changed to neutral from positive. Trades above its 20 day MA. Momentum trends down. Score dropped to 2.
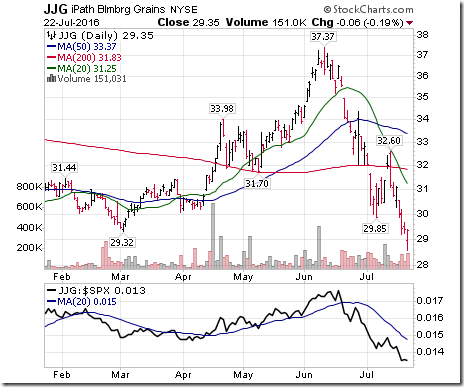
The Grain ETN plunged $1.33 (4.52%) last week. Down trend was confirmed on a move below $29.32 to an all-time low. Strength relative to the S&P 500 Index remains negative. Units remained below their 20 day moving average. Momentum remains down. Score: -6
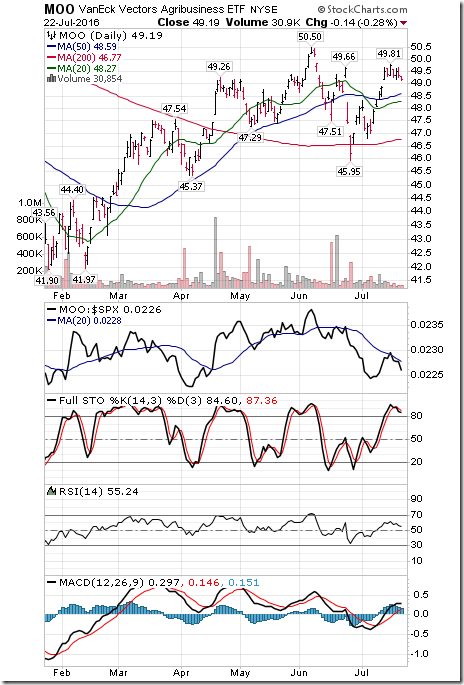
The Agriculture ETF slipped $0.21 (0.43%) last week. Intermediate trend remains neutral. Strength relative to the S&P 500 Index remained negative. Units remained above their 20 day moving average. Short term momentum indicators have just turned down. Technical score slipped last week to -2 from 0.
Interest Rates
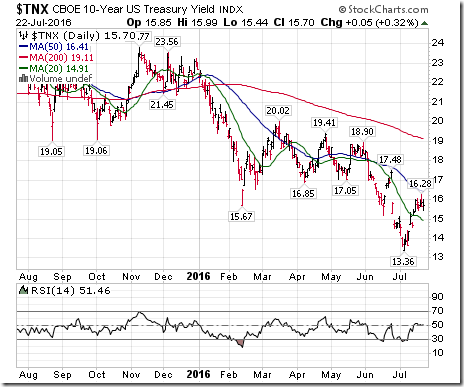
Yield on 10 year Treasuries dropped 2.4 basis points (1.51%) last week. Intermediate trend remains down. Yield remained above its 20 day moving average. Short term momentum indicators are trending up.
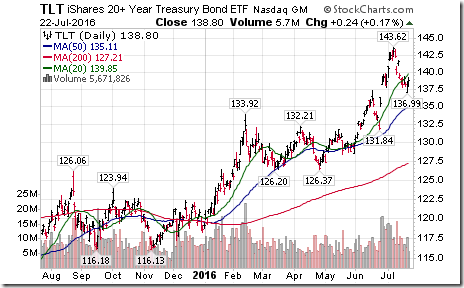
Conversely, price of the long term Treasury ETF added $0.41 (0.29%) last week. Intermediate trend remains up. Price remains below its 20 day moving average.
Volatility
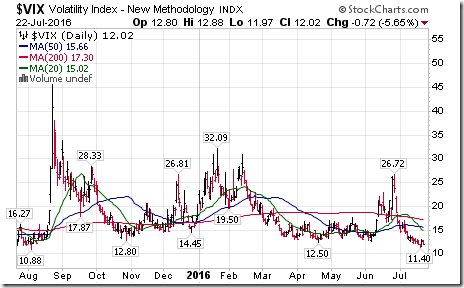
The VIX Index dropped another 0.52 (4.15%) last week after touching a 12 month low. Intermediate trend remains down. The Index remains below its 20 day moving average.
Sectors
Daily Seasonal/Technical Sector Trends for March July 22nd 2016
Green: Increase from previous day
Red: Decrease from previous day
Special Free Services available through www.equityclock.com
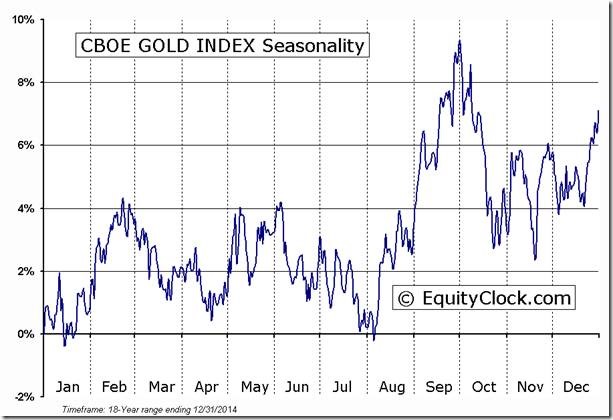
Equityclock.com is offering free access to a data base showing seasonal studies on individual stocks and sectors. The data base holds seasonality studies on over 1000 big and moderate cap securities and indices. To login, simply go to http://www.equityclock.com/charts. Following is an example:
StockTwits Released on Friday @EquityClock
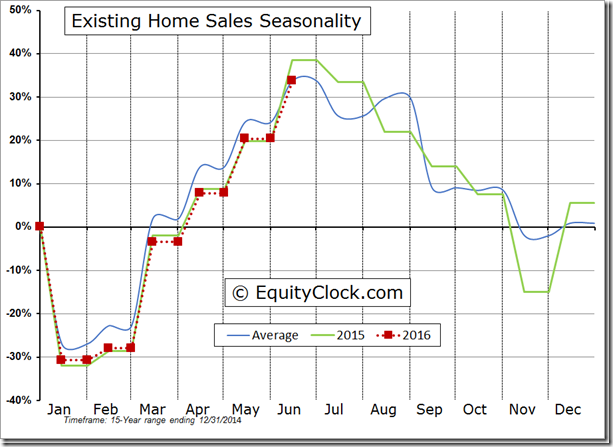
The seasonal peak in existing home sales is upon us.
Technical action by S&P 500 stocks to 10:00: Mixed. Breakouts: $ROST, $PFG, $VTR. Breakdowns: $DNR, $NE
Editor’s Note: After 10:00 AM EDT, MJN, SLB, HIG, NTAP, LB and STZ broke resistance and none broke support.
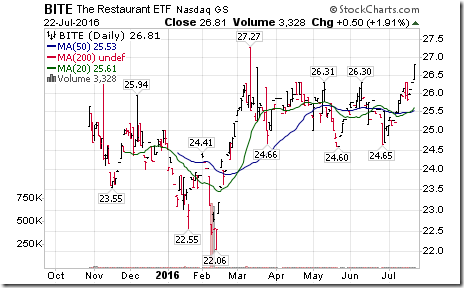
Nice breakout by Restaurant ETF $BITE above $26.31 prior to start of the Olympics.
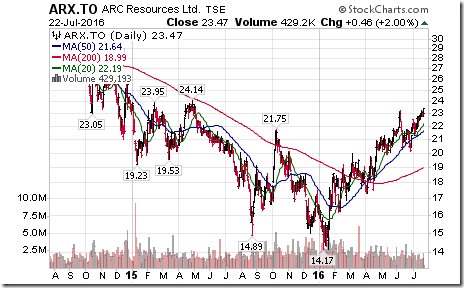
Nice breakout by ARC Resources $ARX.CA above $23.29 extending an intermediate uptrend.
The Canadian Dollar $CDW broke support at US 75.90 cents establishing a new intermediate downtrend.
Accountability Report
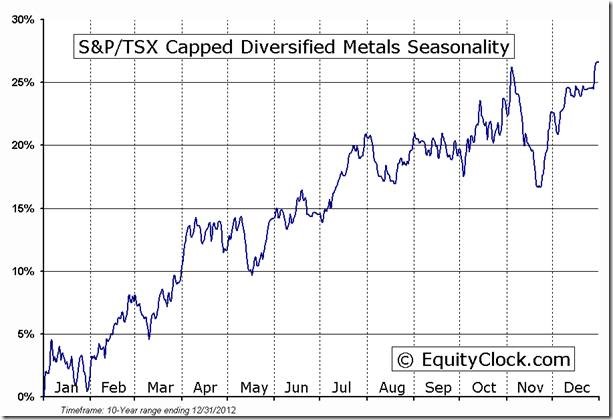
Tech Talk favourably commented on the TSX Metals & Mining Index, related base metal prices and base metal equities on many occasion since June 29th. Comments were supported by price and seasonality charts. Comments were provided in Tech Talk reports released on June 29th, June 30th, July 12th and July 13th. Since the close on June 29th, the TSX Metals and Mining Index has gained 14.9%.
As indicated in the above chart, end of the current period of seasonal strength is this week. In addition, short term momentum indicators for the Index have rolled over from overbought levels. Strength in the U.S. Dollar Index has been a contributor to price weakness.
Conclusion: The TSX Metals & Mining Index and related equities no longer are supported. Seasonal investors preferably will take profits on strength this week.
Disclaimer: Seasonality and technical ratings offered in this report by www.timingthemarket.ca and www.equityclock.com are for information only. They should not be considered as advice to purchase or to sell mentioned securities. Data offered in this report is believed to be accurate, but is not guaranteed
Copyright © DV Tech Talk, Timingthemarket.ca


![clip_image002[5] clip_image002[5]](https://advisoranalyst.com/wp-content/uploads/2019/08/3f03e05fd356084ec00d2cf5a96ecdff.png)
![clip_image002[7] clip_image002[7]](https://advisoranalyst.com/wp-content/uploads/2019/08/435413ee43fcd59e3e2d39a5069d754d.png)
![clip_image002[9] clip_image002[9]](https://advisoranalyst.com/wp-content/uploads/2019/08/792acd98de4741699a06872562ce9cfd.png)
