


Record highs without record earnings? Nothing new
by Dr. Brian Jacobsen, CFA, CFP, Wells Fargo Asset Management
Depending on whom you ask, we’re either in the middle of an earnings recession or we’re emerging from one. Most of this analysis is based on year-over-year changes in earnings per share (EPS) for stocks. This week, as 90 of the biggest U.S. companies post results, analysts are comparing EPS for the second quarter of 2016 with the previous year’s numbers.
But what do EPS results for the second quarter of 2015 have to do with your portfolio?
Nothing. Future cash flows matter, not past earnings. Looking at year-over-year changes will make you blind to turning points in the earnings cycle. On a quarter-over-quarter basis, earnings are increasing, not continuing to run negative.
Another problem in today’s typical approach to analysis is in looking at metrics called adjusted EPS; other firms call them operating EPS. What these companies all do is make adjustments to EPS that the analysts think are one-offs, irrelevant, or misleading. What these adjustments have in common is that they are all deviations from Generally Accepted Accounting Principles. They purport to show what the underlying earnings strength of a firm is. To that end, different sources give different numbers, and they have different degrees of predictive power. According to Thomson Reuters I/B/E/S, second-quarter adjusted EPS is expected to decline 4.7% from a year earlier. According to S&P Capital IQ, operating EPS (similar to adjusted EPS, in concept) is expected to increase 7.3%.
One preaches despair; the other, hope.
Looking at year-over-year changes in adjusted (or operating) EPS is like comparing a mysterious number with a meaningless number, if you’re using them for allocating assets in your portfolio. Instead, you should consider looking for deviations from analysts’ expectations, which my colleague Jeff Moser at Golden Capital Management has written about.
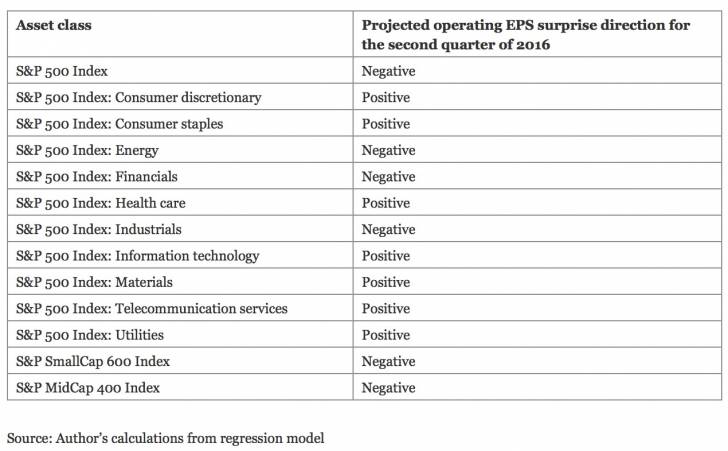
I expect operating EPS for the second quarter to come in at $27.42 for the S&P 500 Index, just a hair less than the S&P Capital IQ number. I get my outlook from a regression model where the dependent variable is the upcoming quarter’s EPS and the explanatory variables are previous values and transformations of the following factors:
- Average weekly hours manufacturing
- Average weekly initial unemployment claims
- BofA Merrill Lynch US High Yield-Yield to Worst
- Consumer confidence
- Consumer credit outstanding
- Crude-oil prices
- Federal funds rate
- ISM new orders index
- Manufacturers’ new orders, consumer goods, and materials
- Manufacturers’ new orders, nondefense capital goods excluding aircraft
- Money supply (M2)
- Real trade-weighted exchange rate
- S&P GSCI (commodity price index)
- S&P 500 Index price level
- 10-year Treasury yield
I use this variable set to forecast the EPS for the S&P 500 Index, the S&P SmallCap 600 Index, the S&P MidCap 400 Index, and the 10 different sectors of the S&P 500 Index.
July 11, 2016, marked the 417th day since the S&P 500 Index hit a record high; only 12 other times had it taken longer to hit a new record high. The average time between record highs was 28.8 days, with a median of 2 days. New highs used to be old hat. Don’t let the fact that we are at record highs on the S&P 500 Index without record earnings distract you. Since 1928, the market has spent 4.8% of the time at record highs. Based on quarter-end data going back to 1988, only 54% of the instances when we saw record highs on the S&P 500 Index did we also see record-high operating EPS results. That’s because investing is about more than operating EPS.
Over the next few quarters, I expect we could see operating EPS continue to rise. Incremental improvements may continue to help support the broader market. In fact, by the third quarter, we should have new record highs for operating EPS. That mixes nicely with record highs on the S&P 500 Index. Record operating EPS should help that other elusive factor that drives stock prices: sentiment.
Copyright © Wells Fargo Asset Management