Did the S&P 500 Just Enter a New Bull Market?
by LPL Research
In the midst of more new all-time highs for the S&P 500 and the Dow—up nine consecutive days for only the seventh time going back more than 40 years—something else has happened that is very meaningful: The S&P 500 is officially up more than 20% from the February lows. This raises another question: Did a new bull market just start?
When the S&P 500 drops 10% or more we hear a lot how it has reached the “correction mode,” while a drop of 20% or more is the mark of a new bear market. What we don’t hear as much about is when the S&P 500 is up 20% from major lows—is this the start of a new bull market? Maybe there is no true answer to this, but it is quite interesting how little attention this current level, of up 20% off the lows, has received.
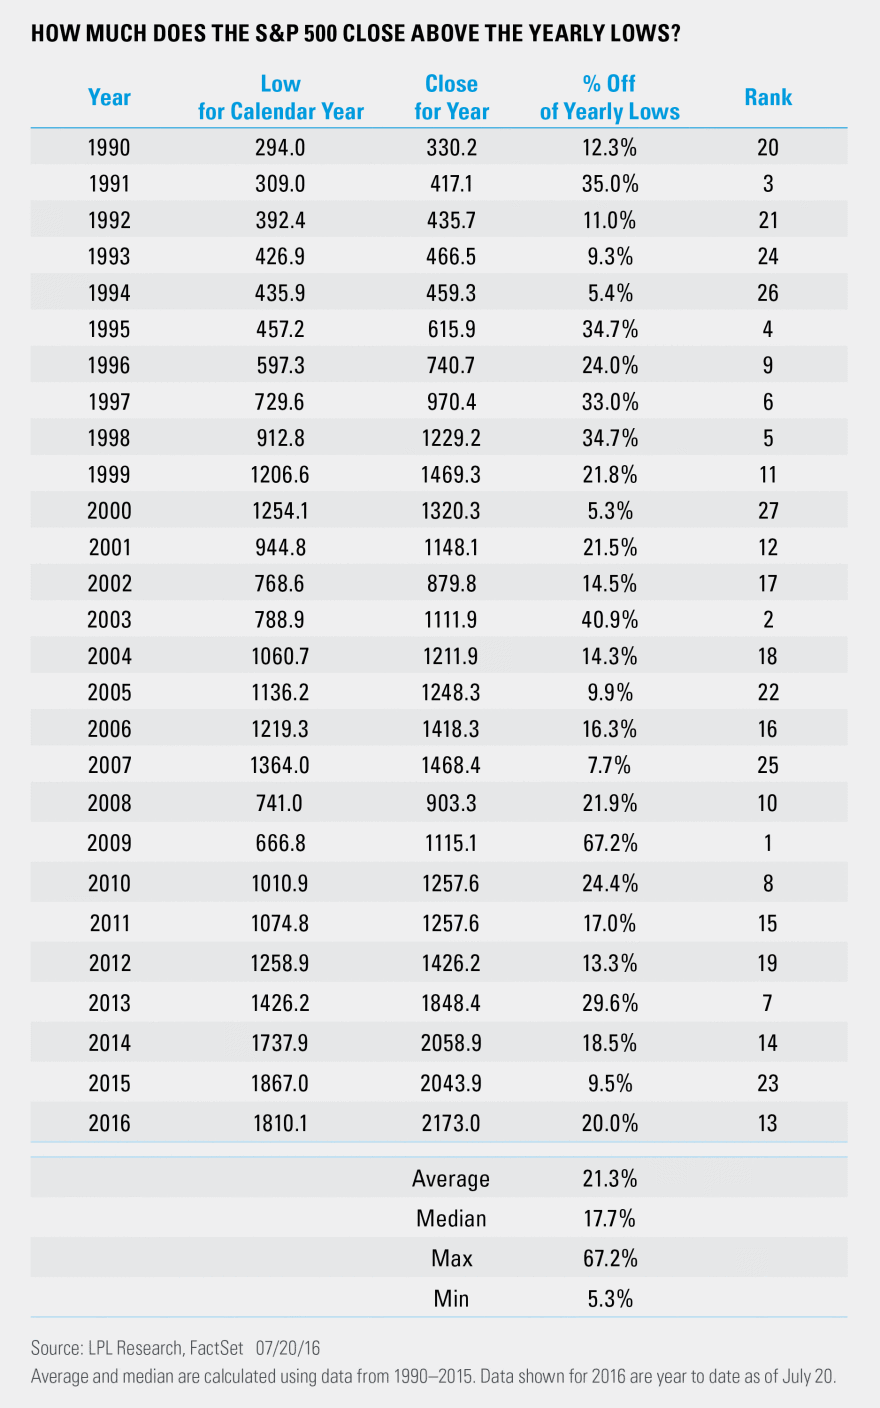
Another important point to examine is: How rare is it that the S&P 500 is up 20% from its intra-year lows? It turns out, maybe it isn’t as rare as it sounds. Going back to 1990, 12 of the past 26 years saw the S&P 500 close the year 20% or more above the calendar year low. Taking it a step further, the average bounce from the calendar year lows has been 21.3%, which is still above the current 20% bounce; the median move is a little lower at 17.7%. Lastly, the move off the lows this year ranks 13th out of 27 total years since 1990, so pretty much right in the middle of the pack.
This helps to put in perspective that most years do tend to see a significant move off of their calendar year lows. Even 2008, which lost 38.5%, saw a bounce of 21.9% off of its lows set on November 21, 2008. Of course, most years tend to bottom early in the year and see gains the rest of the year, so larger sized gains makes sense. What makes the recent 20% bounce special is that it took place in just over five months (110 trading days to be exact) and that is much rarer. Again, some years bottom in January or February and have 10 months to post gains from there. We will look into 20% rallies in short time frames soon.
IMPORTANT DISCLOSURES
Past performance is no guarantee of future results. All indexes are unmanaged and cannot be invested into directly. Unmanaged index returns do not reflect fees, expenses, or sales charges. Index performance is not indicative of the performance of any investment.
The economic forecasts set forth in the presentation may not develop as predicted.
The opinions voiced in this material are for general information only and are not intended to provide or be construed as providing specific investment advice or recommendations for any individual security.
Stock investing involves risk including loss of principal.
The S&P 500 Index is a capitalization-weighted index of 500 stocks designed to measure performance of the broad domestic economy through changes in the aggregate market value of 500 stocks representing all major industries.
Because of their narrow focus, specialty sector investing, such as healthcare, financials, or energy, will be subject to greater volatility than investing more broadly across many sectors and companies.
This research material has been prepared by LPL Financial LLC.
To the extent you are receiving investment advice from a separately registered independent investment advisor, please note that LPL Financial LLC is not an affiliate of and makes no representation with respect to such entity.
Not FDIC/NCUA Insured | Not Bank/Credit Union Guaranteed | May Lose Value | Not Guaranteed by any Government Agency | Not a Bank/Credit Union Deposit
Securities and Advisory services offered through LPL Financial LLC, a Registered Investment Advisor
Member FINRA/SIPC
Tracking #1-518580 (Exp. 07/17)


