Technically Speaking: Breakout Or Market Meltup?
by Lance Roberts, Clarity Advisors
Back in April, as the market surged off of the February lows, I discussed that the “Bear Market Was Over…For Now.” To wit:
“Over the last couple of weeks, in both the daily blog and weekly newsletter, I have been laying out the technical case for a breakout above the downtrend. Such a breakout would demand a subsequent increase in equity risk in portfolios.
The breakout above the downtrend resistance suggests a moderate increase in equity exposure is warranted. The breakout also suggests that markets will now try to advance back to old highs from last year.”
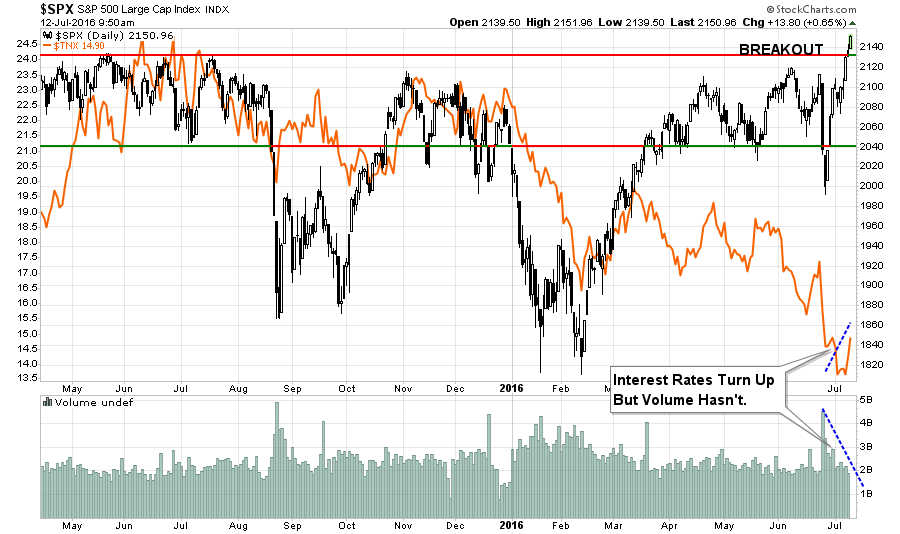
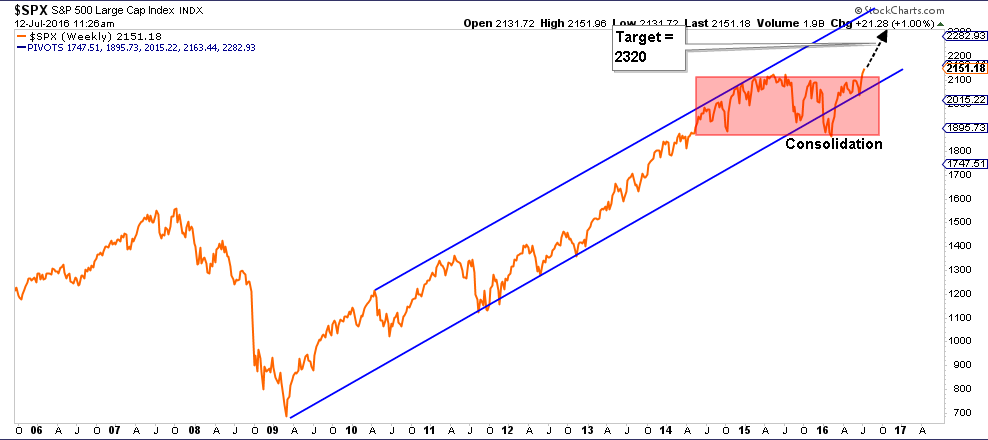
As noted, the breakout back in April has indeed allowed the market to advance back to, and break above, the previous highs from last year as shown in the chart below.

However, while the breakout has occurred, it is also critical that the breakout holds through the end of this week as I stated in this past weekend’s newsletter. (Free E-Delivery Subscription)
“The push on Friday was enough to trigger a short-term buy signal and set the market up for a push to all-time highs. However, don’t get too excited just yet. There are several things that need to happen before you going jumping head first into the pool.
- We have seen repeated breakout attempts on Friday’s previously which have failed to hold into the next week.Therefore, IF this breakout is going to succeed, allowing us to potentially increase equity allocation risk, it must hold through next Friday.
- The overbought condition on a weekly basis needs to be resolved somewhat to allow enough buying power to push stocks above 2135 with some voracity. A failure at that resistance level could lead to a bigger retracement back into previous trading range of 2040-2100.
- Interest rates, as shown below, need to start “buying the rally” showing a shift from “safety” back into “risk” as seen following the April deviation. (Gold bars show declining rates correlated with falling asset prices. Green bars are rising rates correlated rising assets.)
- Volume needs to start expanding, second chart below, to confirm “conviction“ to a continuation of the “bull market.”
The next chart looks at each of these points to examine if there are the beginnings of a more “bullish” change to market dynamics. While the breakout has yet to be confirmed through the end of this week, interest rates have turned up suggesting a rotation, at least temporarily, from “safety” back into “risk.” Unfortunately, a pickup in volume to confirm conviction to the move is still lacking at the moment.
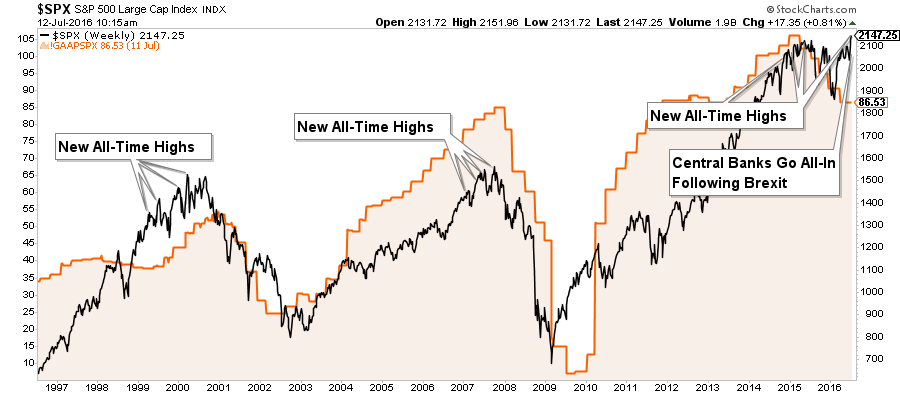
It is worth reminding you, that while the markets are moving higher and pushing new highs currently, it is doing so against a backdrop of weak fundamentals, high valuations, and deteriorating earnings. While these measures are not good timing indicators, they are important, historically speaking, to the longer term viability of a bull rally. As shown below, the history of the markets making new highs during an ongoing market topping process is not unprecedented.
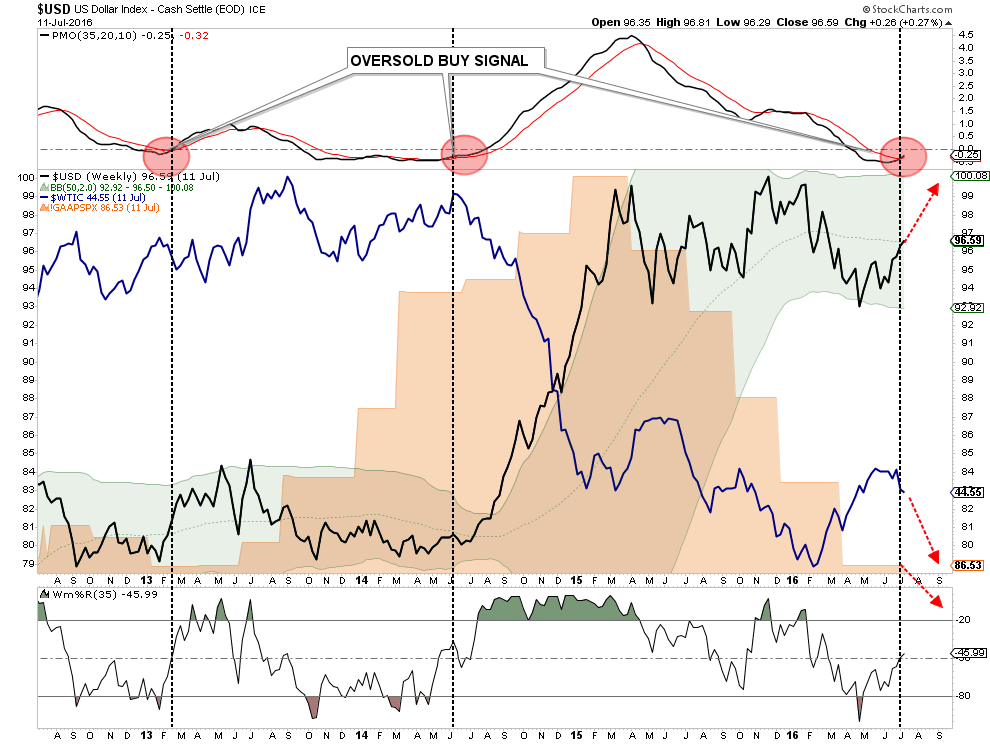
While earnings are set to decline again this quarter which will push valuations even further into the proverbial stratosphere, the real risk to watch is the US Dollar. While Central Banks have gone all in, including the BOJ with additional QE measures of $100 billion, to bail out financial markets and banks following the “Brexit” referendum, it could backfire badly if the US dollar rises from foreign inflows. As shown below, a stronger dollar will provide another headwind to already weak earnings and oil prices in the months ahead which could put a damper on the expected year-end “hockey stick” recovery currently expected.
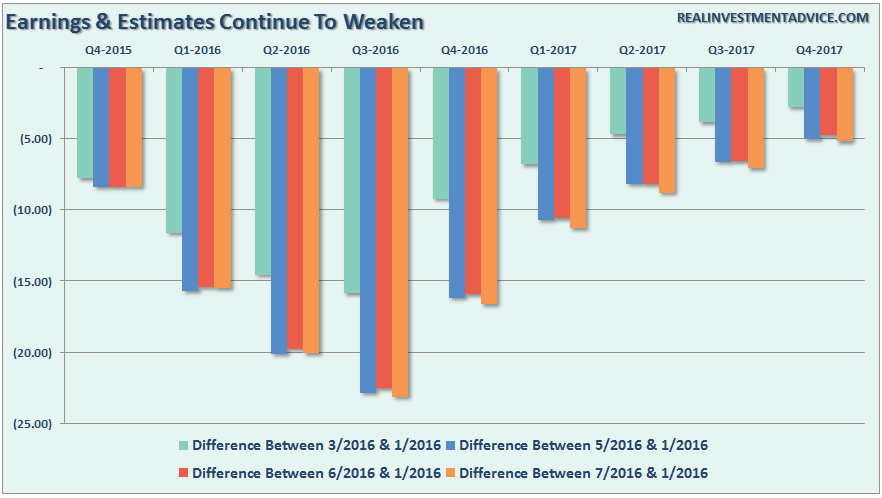
As mentioned…the earnings outlook could be in jeopardy. The chart below compares recent months to where estimates stood in January of this year. As of July 1st, forward estimates are at their lowest levels. (Let the “beat the earnings” game begin.)
Let me be very clear.
- The market broke out to all-time highs after a long consolidation period. This is bullish.
- Central banks globally are pushing liquidity into the markets. This is also bullish.
- Interest rates are ticking up as money moves from “safety” to “risk.” Also bullish.
- As shown below, all buy signals in the model allocation are triggered suggesting an increase in equity exposure. Again, bullish.

While there are more than sufficient bearish arguments currently to suggest fading the current rally and raising cash, the price action is bullish. No more no less. However, as is always the case, I am increasing exposure with very tight stops and a risk management discipline in tow.
Where To Now?
The obvious question is now: “Where is the market headed to?”
From a technical basis looking at the structure of the trend, and given the probability it is in the latter stages of this particular bull market, we have likely seen the S&P 500 just complete a large consolidation, as mentioned above, concluding Wave 4 of the Elliott Wave principals. This suggests that a Wave 5 has begun (the last part of the trend sequence) which will coincide with the “market melt-up” phase of this advance before the next major correction begins.
Theoretically, once a small correction action that maintains the current bullish-trend works off the current “overbought” condition, the blow-off speculative Wave 5 impulse move should begin.
Wave 5, “market melt-ups” are the last bastion of hope for the “always bullish.” Unlike, the previous advances that were backed by improving earnings and economic growth, the final wave is pure emotion and speculation based on “hopes” of a quick fundamental recovery to justify market overvaluations. Such environments have always had rather disastrous endings and this time, will likely be no different.
Buying Because I Have To. You Don’t.
Let me repeat what I wrote the last time as things have not changed.
“I am buying this breakout because I have to. If I don’t, I suffer career risk, plain and simple.
But you don’t have to. If you are truly a long-term investor, this rally is just a rally. There is no confirmation fundamentally the bull market has yet resumed. Such leaves investors with a tremendous amount of downside risk relative to the reward that is currently being offered.
However, investor patience to remain conservatively invested while what seems like a “bull market” is in force is an extremely difficult thing for most to do.
So, if you buy the breakout, do so carefully. Keep stop losses in place and be prepared to sell if things go wrong.
It is important to remember that the majority of those touting the bull market are simply just getting back to even after an almost year-long sludge. For now, things are certainly weighted towards the bullish camp.
However, such will not always be the case.”
As my Dad used to say:
“If you are going to walk through a bed of snakes, I would suggest doing so very carefully.”
He was probably right.
Lance Roberts
Lance Roberts is a Chief Portfolio Strategist/Economist for Clarity Financial. He is also the host of “The Lance Roberts Show” and Chief Editor of the “Real Investment Advice” website and author of “Real Investment Daily” blog and “Real Investment Report“. Follow Lance on Facebook, Twitter, and Linked-In
Copyright © Clarity Advisors