by Don Vialoux, Timingthemarket.ca
Mr. Vialoux on BNN’s Market Call yesterday
Following are links:
http://www.bnn.ca/Video/player.aspx?vid=908858 Market overview
http://www.bnn.ca/Video/player.aspx?vid=908865
http://www.bnn.ca/Video/player.aspx?vid=908864
http://www.bnn.ca/Video/player.aspx?vid=908878 Past Picks
http://www.bnn.ca/Video/player.aspx?vid=908879
http://www.bnn.ca/Video/player.aspx?vid=908880
http://www.bnn.ca/Video/player.aspx?vid=908886
http://www.bnn.ca/Video/player.aspx?vid=908887 Top Picks
Following are notes prepared before start of the show:
Market Outlook
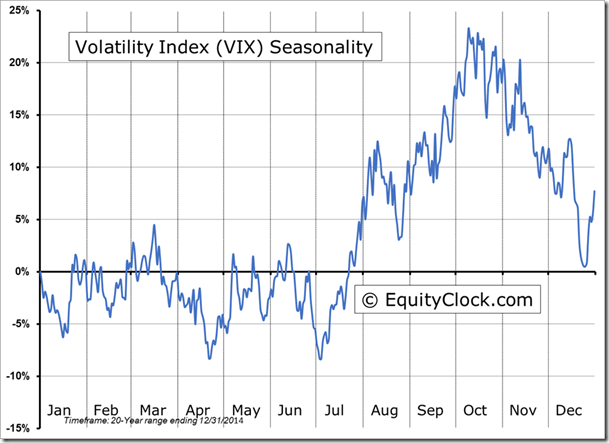
North American equity markets are about to enter into a period of higher volatility, typical of the period from mid-June to mid-October when North American equity markets experience at least a mild correction.
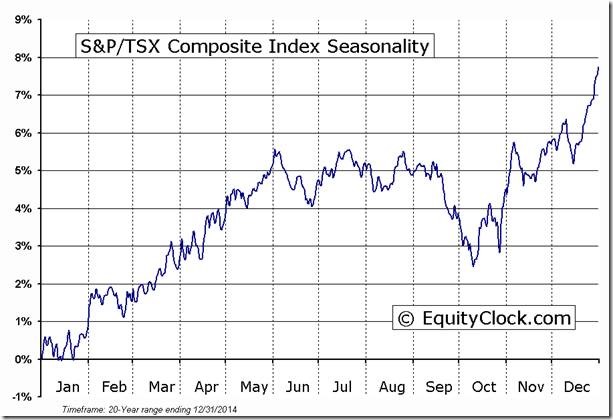
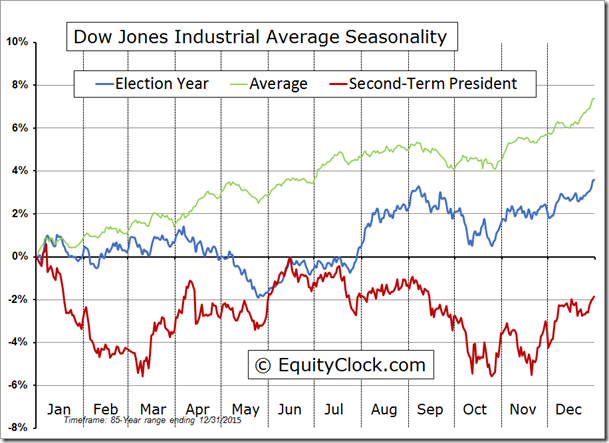
Following are seasonality charts for the Dow Jones Industrial Average and TSX Composite that demonstrate. Note their double peaks that occur approximately July 17th, an estimated start of the next intermediate correction associated with increasing volatility
The seasonality chart of the Dow Jones Industrial Average during U.S. Presidential Election years is interesting, particularly looking at performance of the Average following the end of a two term president.
The correction in summer associated with higher volatility has occurred during each of the past 8 years for a variety of reasons, problems in China, conflicts in the Ukraine, a financial crisis in Greece, etc. Possible reasons for a correction this summer include concerns about the U.S. Presidential race, control over Congress, Brexit and rising racial tensions in the U.S.
Another reason for a correction this summer is the reporting of second quarter results. Consensus is calling for a 6.2% year-over-drop in earnings by S&P 500 companies. The earnings picture is slightly better for Dow Jones Industrial Average companies with an average (median) gain in earnings of 2.1% and for TSX 60 companies with an average (median) gain of 0.68%. Of greater importance, second quarter reports frequently include guidance for third quarter and annual earnings and revenues. Analysts are notorious for overestimating annual earnings prior to release of second quarter results and frequently lower their estimates after release of results. Analyst current estimates for a 7.1% year-over-year increase in fourth quarter earnings by S&P 500 companies are too high and likely will be lowered after companies release second quarter results.
Top 3 picks
All picks are based on a seasonal spike in volatility from early July to mid-October
1.Gold Bullion
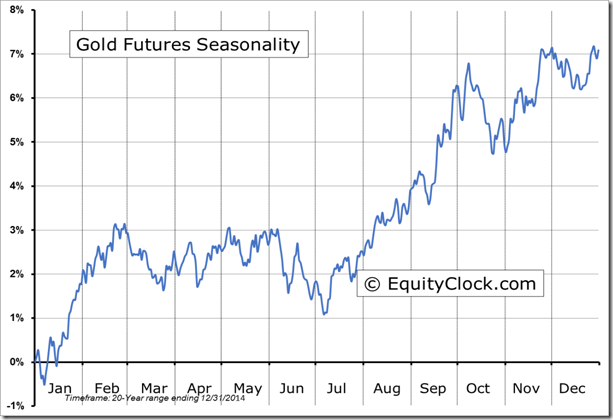
The period of seasonal strength for gold bullion is virtually identical from early July to mid-October to the period of seasonal strength in the VIX Index
Technical profile for gold also is positive: Upward intermediate trend, outperformance relative to the S&P 500, positive momentum indicators.
2.Silver
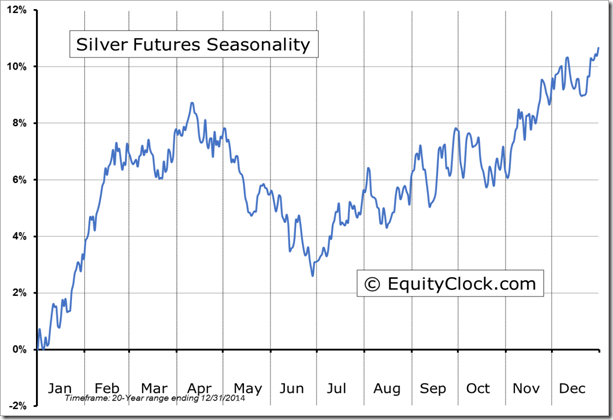
Silver has similar seasonality to gold. Recently the silver/gold ratio bottomed near 0.12 and has started to trend higher implying better medium term performance for silver.
3 Cash
North American equity prices technically are overbought. Medium term momentum indicators for the S&P 500 Index and TSX Composite Index already are slowing. Better to take some equity money off the table and wait for the next buying opportunity (probably in late October just before election of the next U.S. President.
Technical Action by Equity Markets Yesterday
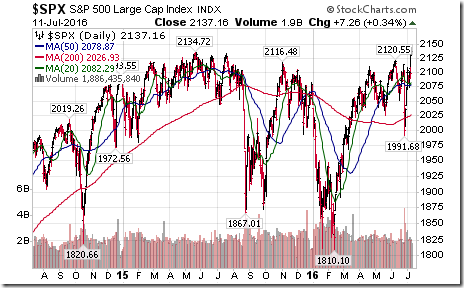
The S&P 500 Index broke to an all-time high yesterday on a move above 2,134.72.
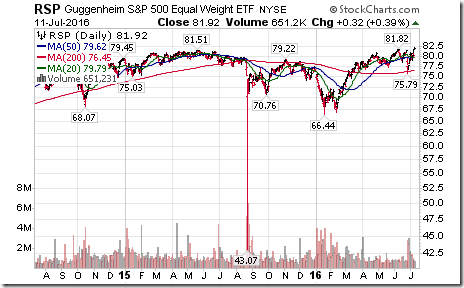
Ditto for the Equally-Weighted S&P 500 ETF!
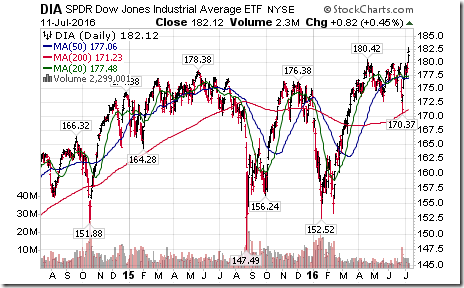
Ditto for Dow Jones Industrial Average ETF (DIA)!
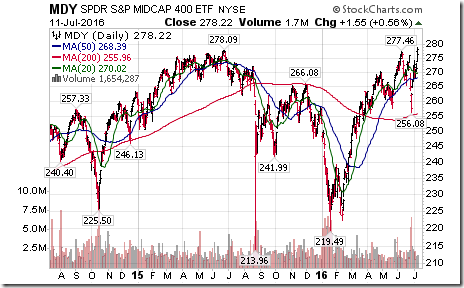
Ditto for Mid-cap SPDRS (MDY)!
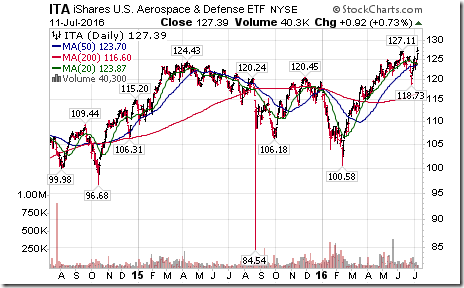
Ditto for the Aerospace & Defense ETFs thanks partially to aerospace contracts signed at the Farnborough Airshow yesterday!
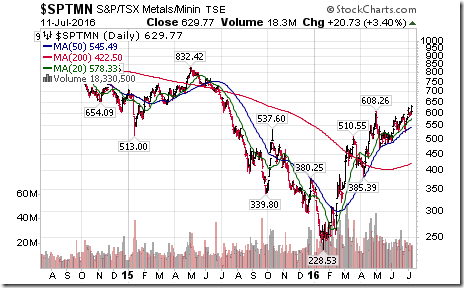
TSX Metals and Mining stocks led strength by the TSX Composite Index by breaking above 608.26 to a 12 month high. Higher copper and zinc prices yesterday helped.
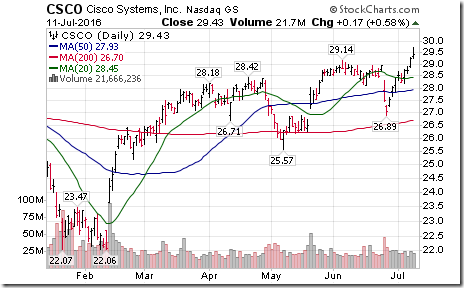
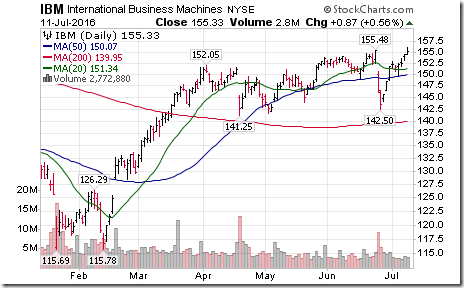
Twenty six S&P 500 stocks broke intermediate resistance levels yesterday. Prominent stocks included CSCO and IBM.
Trader’s Corner
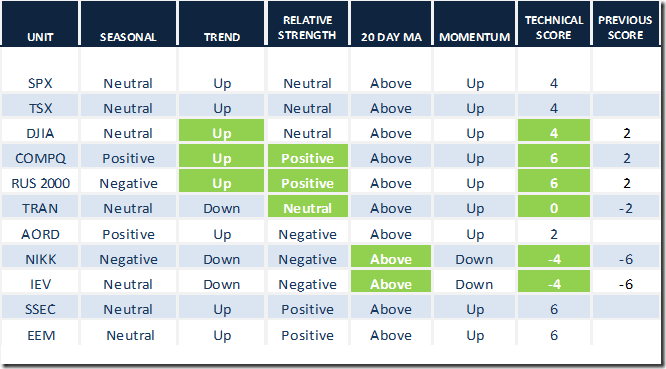
Daily Seasonal/Technical Equity Trends for July 9th 2016
Green: Increase from previous day
Red: Decrease from previous day
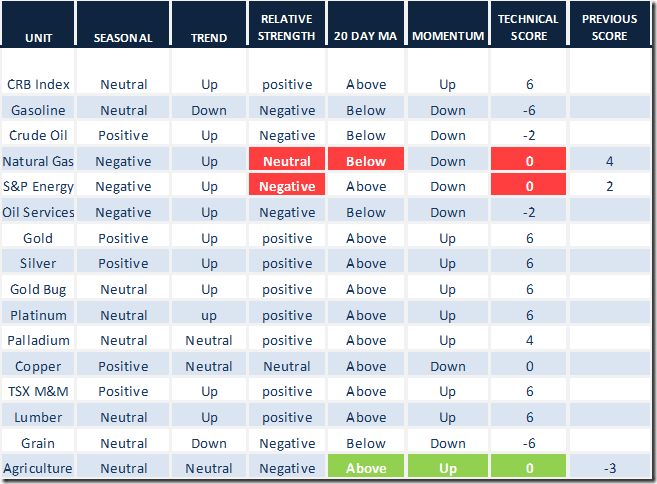
Daily Seasonal/Technical Commodities Trends for July 9th 2016
Green: Increase from previous day
Red: Decrease from previous day
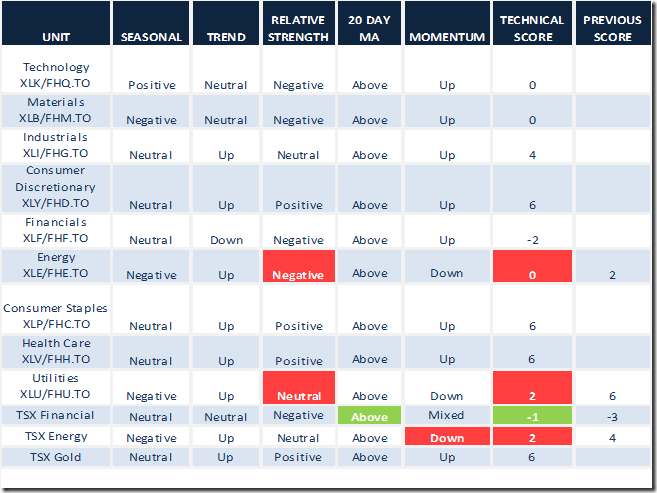
Daily Seasonal/Technical Sector Trends for March July 9th 2016
Green: Increase from previous day
Red: Decrease from previous day
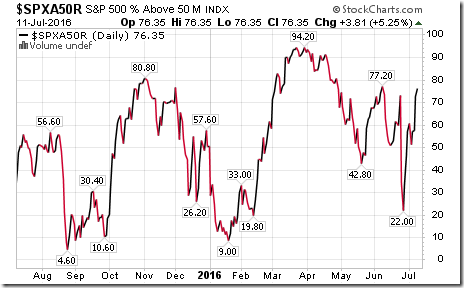
S&P 500 Momentum Barometer
The Barometer gained 3.81 (5.25%) to 76.35 yesterday. It remains intermediate overbought level.
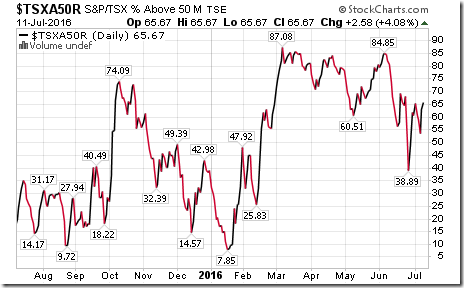
TSX Composite Momentum Barometer
The Barometer added 2.58(4.08%) to 65.67 yesterday. It remains intermediate overbought.
Disclaimer: Seasonality and technical ratings offered in this report by www.timingthemarket.ca and www.equityclock.com are for information only. They should not be considered as advice to purchase or to sell mentioned securities. Data offered in this report is believed to be accurate, but is not guaranteed
Copyright © DV Tech Talk, Timingthemarket.ca


