by Don Vialoux, Timingthemarket.ca
Observations
Brexit polls had a direct impact on equity markets yesterday. Early weakness was triggered by a poll suggesting that the U.K will leave the European economic union. Gold and the VIX Index spiked. Late strength was triggered by another poll suggesting that the U.K. will stay in the union. Gold and the VIX Index dropped.
Today is quadruple witching day, last trade date for June equity and index listed options and futures. Volume is expected to be well above average as investors roll positions to future months.
StockTwits Released Yesterday @EquityClock
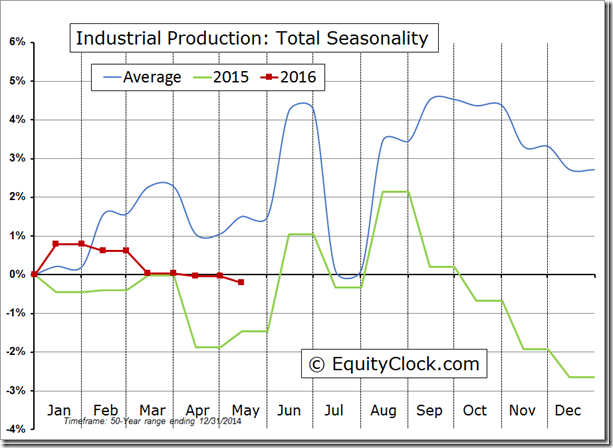
Industrial Production taking a recessionary tilt, posting a rare decline in May.
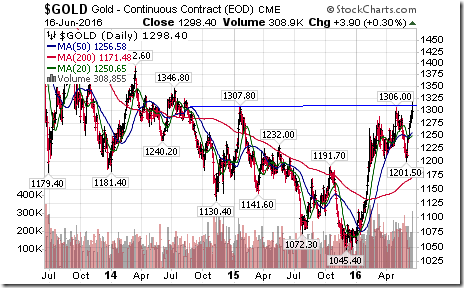
Gold briefly moved above 1,307.80 per ounce completing a modified reverse Head & Shoulders pattern.
Editor’s Note: Subsequently, gold reached a high of $1.318.90, but lost most of its gains in afternoon trade.
Technicals for S&P 500 stocks to 1:00 PM: Bearish. 28 stocks broke support and 3 stocks broke resistance
Editor’s Note: After 1:00 PM EDT, Clorox (CLX) broke on the upside and Cigna (CI) broke on the downside
Financials dominated the list of stocks breaking support: $BRKB, $CMA, $ETFC, $HBAN, $HIG, $L, $PFG, $RF, $NAVI, $USB, $WFC
Interesting Charts
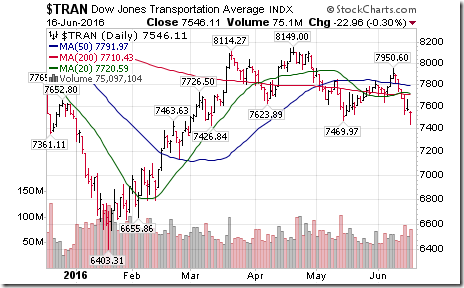
Dow Jones Transportation Average dropped below support at 7,469.97 to establish an intermediate downtrend.
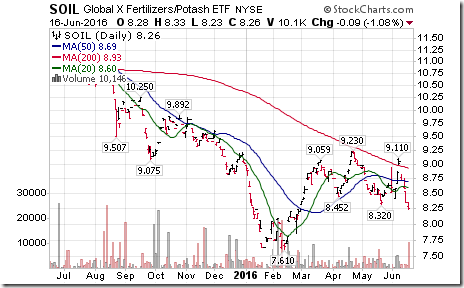
Fertilizer stocks continue to struggle.
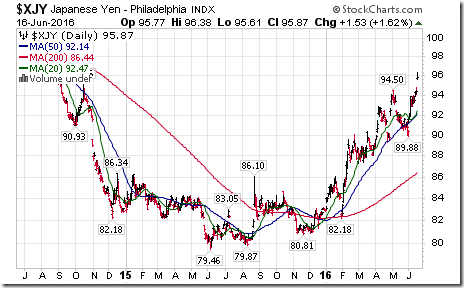
The Japanese Yen continues to soar.
Trader’s Corner
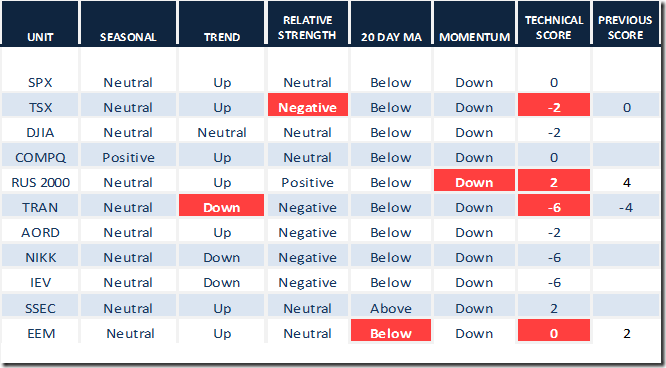
Daily Seasonal/Technical Equity Trends for June 16th 2016
Green: Increase from previous day
Red: Decrease from previous day
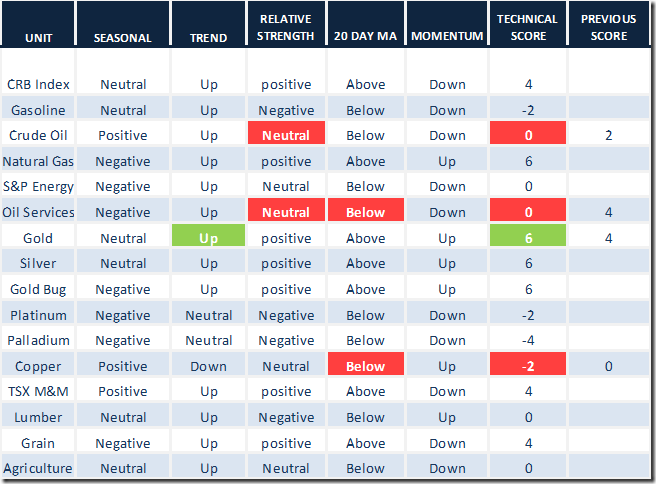
Daily Seasonal/Technical Commodities Trends for June 16th 2016
Green: Increase from previous day
Red: Decrease from previous day
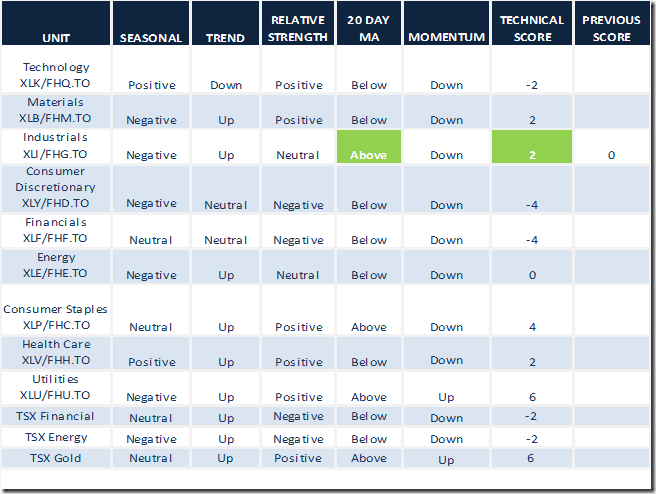
Daily Seasonal/Technical Sector Trends for March June 16th 2016
Green: Increase from previous day
Red: Decrease from previous day
Special Free Services available through www.equityclock.com
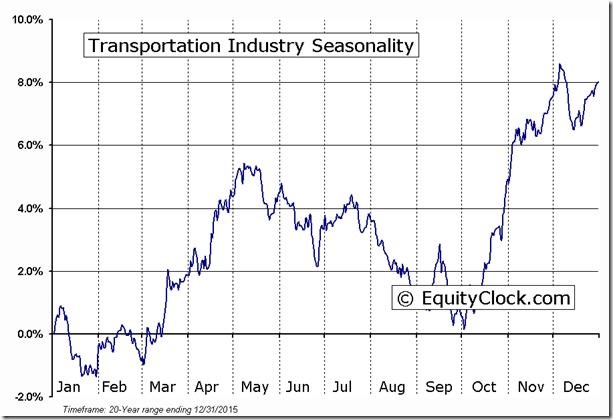
Equityclock.com is offering free access to a data base showing seasonal studies on individual stocks and sectors. The data base holds seasonality studies on over 1000 big and moderate cap securities and indices. To login, simply go to http://www.equityclock.com/charts. Following is an example:
S&P 500 Momentum Barometer
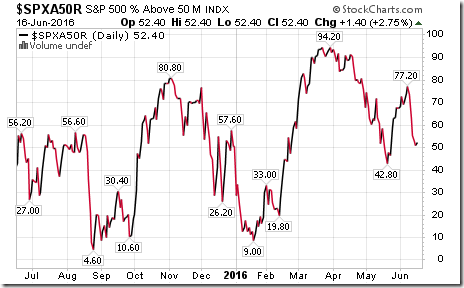
The Barometer added 1.40 to 52.40 yesterday. The barometer remains intermediate overbought with a short term downtrend.
TSX Composite Momentum Barometer
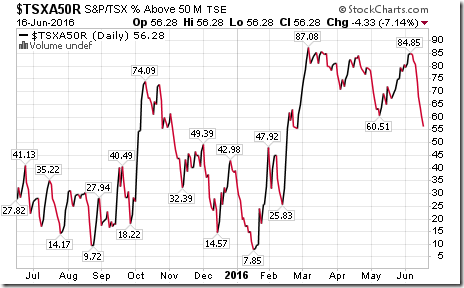
The Barometer dropped another 4.33 to 56.28. The Barometer remains intermediate overbought with a short term downtrend.
Disclaimer: Seasonality and technical ratings offered in this report by www.timingthemarket.ca and www.equityclock.com are for information only. They should not be considered as advice to purchase or to sell mentioned securities. Data offered in this report is believed to be accurate, but is not guaranteed
Copyright © DV Tech Talk, Timingthemarket.ca


