by Don Vialoux, Timingthemarket.ca
Observations
Quiet equity market response to the FOMC meeting and Janet Yellen’s comments! The Fed indicated that it is not quite ready to raise the Fed Fund rate and did not offer guidance when the next rate hike will occur. North American equity markets eased lower in late trading.
Heads up to a significant U.S. market event during the next two trading days! Quadruple witching occurs on Friday. Volumes normally are higher than average during Quadruple Witching, but are expected to be higher than average for a Quadruple witching period this time due to the larger than average amount of June derivatives that are expected to roll over.
StockTwits Released Yesterday @EquityClock
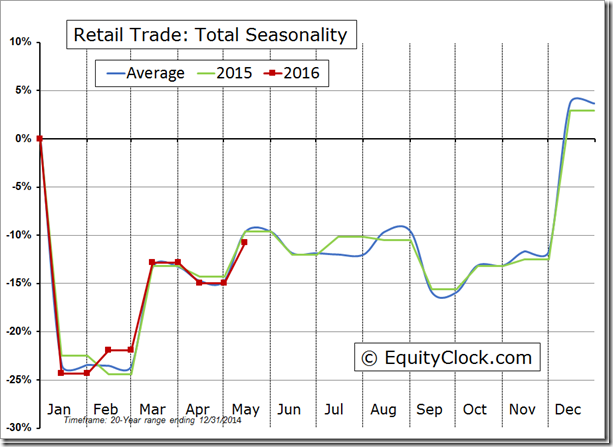
Gasoline sales fuel strength in retail trade in May.
Technical action by S&P 500 stocks to 10:00: Quiet. Breakouts: $PVH. Breakdowns: $PGR
Editor’s Note: After 10:00 AM EDT, one more stock broke support: Edwards Lifesciences (EW)
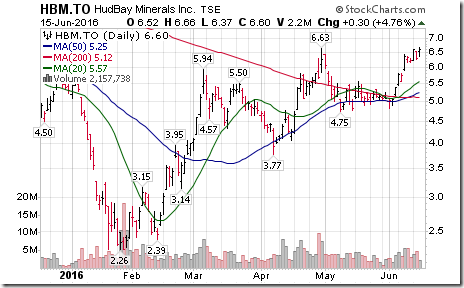
Nice breakout by zinc sensitive Hudbay Minerals $HBM.CA above $6.63 extending intermediate uptrend.
Interesting Chart
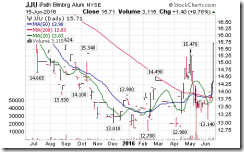
Base metal prices were notably higher yesterday, led by strength in aluminum prices
Trader’s Corner
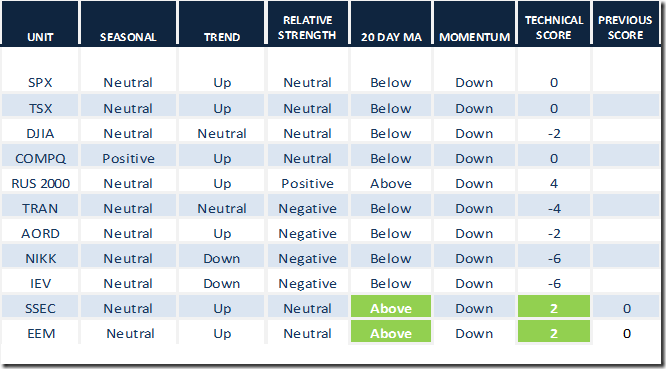
Daily Seasonal/Technical Equity Trends for June 15th 2016
Green: Increase from previous day
Red: Decrease from previous day
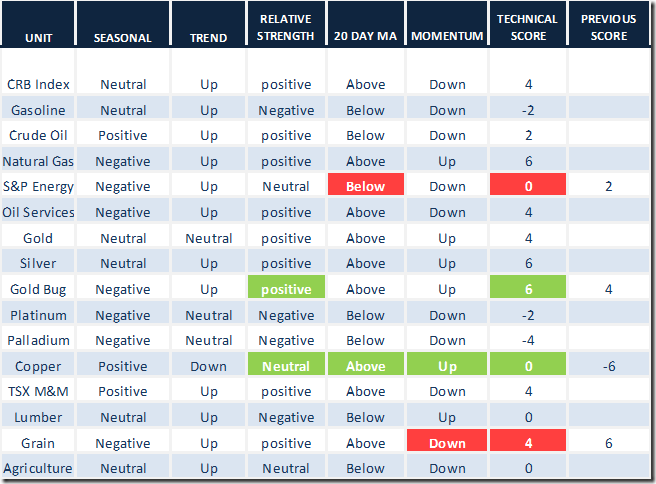
Daily Seasonal/Technical Commodities Trends for June 15th 2016
Green: Increase from previous day
Red: Decrease from previous day
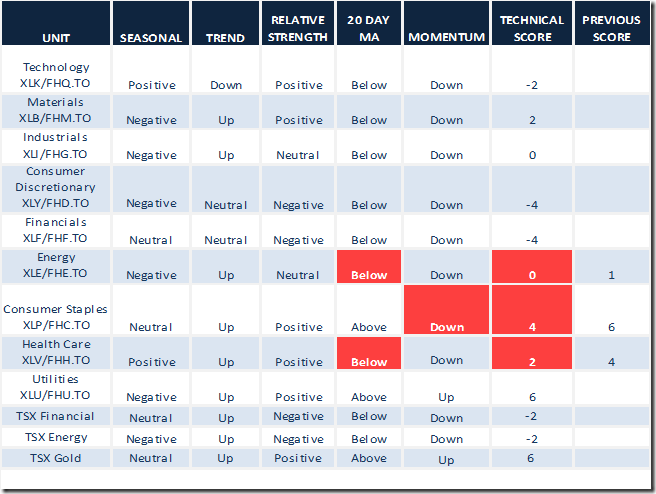
Daily Seasonal/Technical Sector Trends for March June 15th 2016
Green: Increase from previous day
Red: Decrease from previous day
Special Free Services available through www.equityclock.com
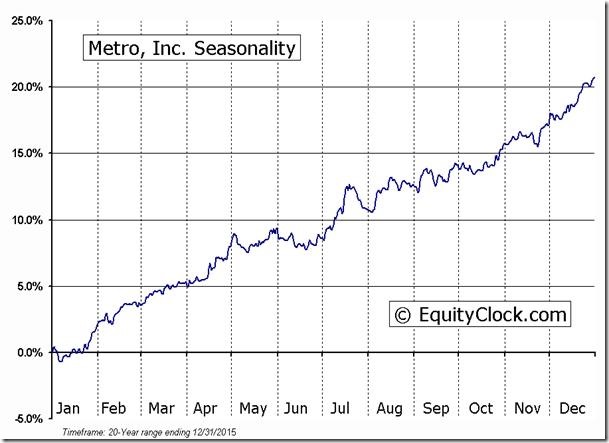
Equityclock.com is offering free access to a data base showing seasonal studies on individual stocks and sectors. The data base holds seasonality studies on over 1000 big and moderate cap securities and indices. To login, simply go to http://www.equityclock.com/charts. Following is an example:
Keith Richards’ Blog
Lessons from a VIX trade. Following is a link:
http://www.valuetrend.ca/lessons-from-a-vix-trade/
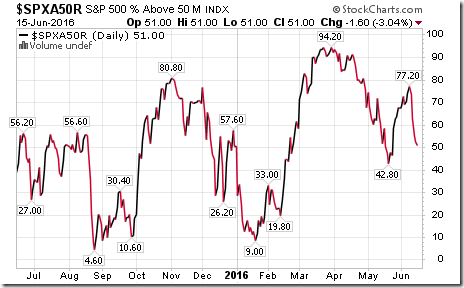
S&P 500 Index Momentum Barometer
The Barometer slipped another 1.60 to 51.00 yesterday. The Barometer remains intermediate overbought and in a short term downtrend.
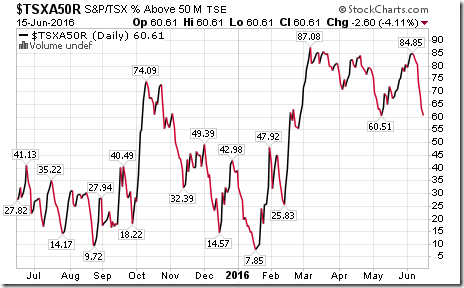
TSX Composite Index Momentum Barometer
The Barometer dropped another 2.60 to 60.61 yesterday. The Barometer remains intermediate overbought and in a short term downtrend.
Disclaimer: Seasonality and technical ratings offered in this report by www.timingthemarket.ca and www.equityclock.com are for information only. They should not be considered as advice to purchase or to sell mentioned securities. Data offered in this report is believed to be accurate, but is not guaranteed
Copyright © DV Tech Talk, Timingthemarket.ca


