
Tactical Trend-Following: Core or Alternative?
by Corey Hoffstein, Newfound Research
Summary
- Answering whether a strategy should be a core holding or an alternative holding often has less to do with the investment strategy itself and more to do with an investor’s understanding of how that strategy will perform.
- Asset classes and strategies that investors are comfortable with, and have a strong understanding of why and when they will perform a certain way, are strong contenders for core holdings.
- What the underlying asset class is less relevant than having an understanding of the strategy. Trend-following equity may not be appropriate as a core holding just because it invests in equity.
- We believe that trend-following equity can be a core holding for those investors who have a strong understanding of performance expectations.
- We introduce the market divergence indicator, which can be used to describe the recent market environment and correlates strongly to relative performance of trend-following strategies.
“Is this a core or alternative holding?” is the question we most often receive about our trend-following strategies.
As with most things in investing, the answer is, from our perspective, not entirely clear cut. The reason the answer is not clear cut is because we believe that the question of core or alternative has less to do with the investment strategy itself, and more to do with expectations and the level of understanding the investor has about the strategy.
Our experience is that core holdings require a keen understanding of when the asset class or strategy will or will not perform well. Alternatives, on the other hand, are often those asset classes or strategies that the advisor is less comfortable with. As a result, they often receive smaller allocations and are given more leeway in their performance.
Consider these interactions between an advisor and a client:
- Client: “My stocks lost money. Why?”
- Advisor: “The economy fell into a recession.”
- Client: “My bonds lost money. Why?”
- Advisor: “Interest rates went up.”
In both cases, while the investment lost money, the advisor had a clear understanding about why the investment performed the way it did. This understanding of why helps set expectations going forward: don’t expect stocks to do well in a recession and don’t expect bonds to do well in a rising rate environment.
Let’s make the example slightly more complicated.
- Client: “My value manager lost money even though the market was up!”
- Advisor: “Yes, but market returns were largely driven by the largest growth stocks this year, and value, as a style, has recently been out of favor. We expect value to outperform over the long run, but in the short run there can be plenty of variation.”
Again, the advisor has a clear understanding about why the approach underperformed. Just as important, the advisor understands that if we believe markets are at least somewhat efficient, then no strategy can consistently out- (or under-) perform. This why again leads to a forward expectation.
In these three cases, with the deep level of understanding and appropriate forward expectations, we would argue that these investments can be core.
On the other hand, consider this interaction:
- Client: “My opportunistic stock-picker lost money even though the market was up!”
- Advisor: “Yeah, he was way over concentrated in a stock that blew up.”
An explanation, yes, but there is no way to derive a forward expectation from it. The explanation is entirely backward looking. Without a style or a process, there is no way to set clear expectations. So even though this is just a stock portfolio – an asset class we just said was likely core – we’d advocate for alternative (or neither – we start to get very nervous when a coherent process cannot be articulated).
Let’s consider another case:
- Client: “Managed futures were flat this year and the market was up 30%! This is the third year in a row managed futures have done nothing!”
There are probably two responses advisors give her:
- Advisor #1: “…”
- Advisor #2: “The managed futures portfolio tries to identify trends in several dozen global markets, including equities, interest rates, currencies, and commodities. While the trend in U.S. equities was strong this year, it only represents a tiny fraction of the overall managed futures portfolio. Unfortunately, many other asset classes around the world did not exhibit trending behavior, and so the gains from investing in U.S. equities were offset by losses in other positions.”
We think you can probably guess which advisor we’d say “core” and which advisor we’d say “alternative” to for managed futures.
Finally – and most relevant to us here at Newfound:
- Client: “My tactical equity portfolio – which is supposed to protect me from losses – lost money this year when the market was flat!”
Again, two responses:
- Advisor #1: “Maybe the process is broken.”
- Advisor #2: “The portfolio follows a trend-following process. Unfortunately, last year there were very few sustained trends, so the portfolio suffered a number of whipsaw trades where they had to unwind positions at a loss.”
Again, we are sure you can guess for which advisor we would advocate our tactical solutions being an alternative and for which we would advocate our tactical solutions being core.
The most important thing is that we don’t just want an explanation of why performance was a certain way, we want an explanation why that sets an expectation for performance going forward.
Expectations about Trend-Following: Lip-Service or Evidence-Based?
Given that many tactical strategies – especially those using trend-following – underperformed last year, for skeptical advisors (and skepticism is a good thing), explanations may feel more like lip-service than meaningful commentary.
With that said, we wanted to spend the rest of this commentary outlining the evidence for when we believe trend-following approaches should and should not do well.
Signal vs. Noise
In broad strokes, we would expect a trend-following strategy to do well when trends are obvious and easy to identify. If the market moves only one direction, then we should be able to quickly identify that direction and put on a position that tracks the market.
On the other hand, if there is a considerable amount of volatility relative to the trend, the trend may be harder to identify.
Consider the following three examples:

We would expect a trend-following strategy to easily be able to capture the trend on the pure signal time series in blue and have increasingly more difficulty as we move to the low signal-to-noise time series in gray.
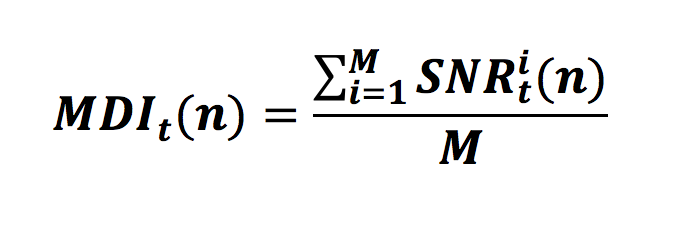
We can quantify this expected difficulty by coming up with a signal-to-noise ratio for a given time period. To capture signal versus noise, we use a simple ratio of how far price moves in total versus the sum of the absolute component moves over time.
The formula we use is:

Note: We use log prices to account for compound growth.
SNR is 1, 0.46, and 0.05 for the pure signal time series, high signal-to-noise time series, and low signal-to-noise time series, respectively. We can see that the values align nicely with our expectations for a trend-following strategy to be able to capture the trend.
This is only one trend, however. Normally a trend-following strategy will try to capture trends across multiple investments at once. To account for this, we can define a market divergence indicator, which tells us, on average, how trendy were the investments in our universe. It does this by simply averaging the SNR value for each investment.
A large positive MDI will indicate a period where many of the underlying investments had strong positive trends. A large negative MDI will indicate a period where many of the underlying investments had strong negative trends.
Why consider the average trendiness of the underlying investments? In a portfolio, it does us little good if there is only one investment exhibiting a significant trend: any gains will be offset by whipsaw losses in the other noisy investments. We need environments where there are a significant number of trends across all of our investments.
To put a concrete example behind these equations, let’s look at the 1-year MDI of the primary U.S. sectors.
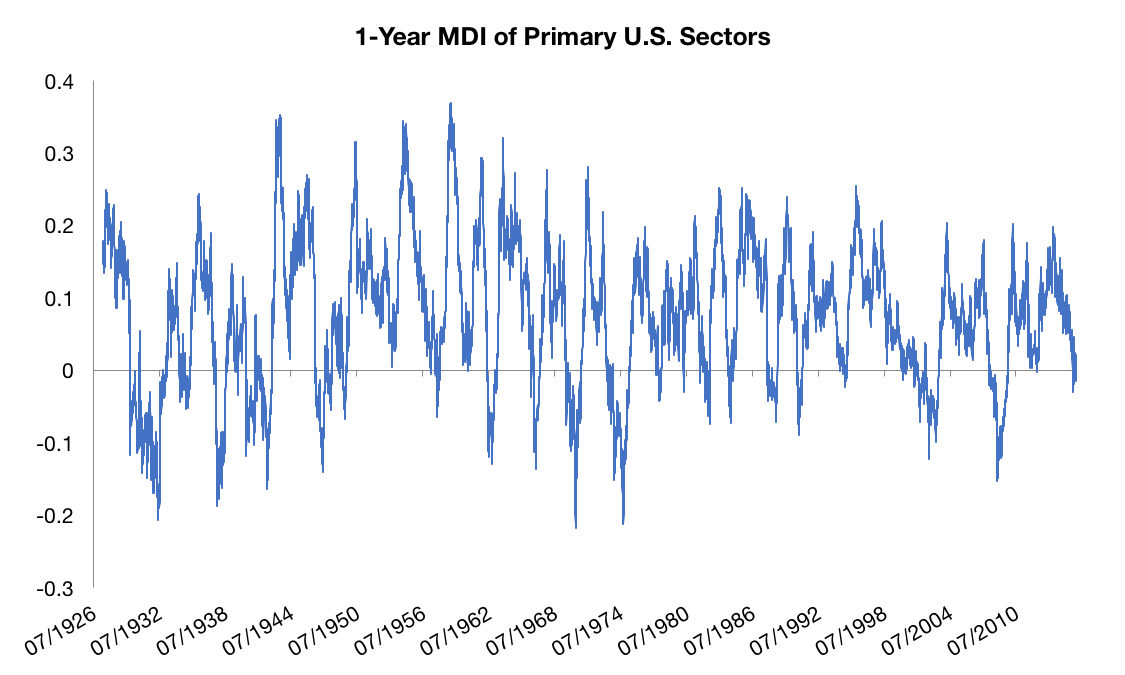
Source: Kenneth French Data Library. Calculations performed by Newfound Research.
Some things we notice:
- The trendiness of the sectors, combined, varies significantly over time.
- Overall trendiness rarely exceeds 0.3 – meaning we never get pure signal to work with.
- Periods of high trendiness (either positive or negative) appear to be periods we would expect a tactical strategy to do well. For example, we most recently saw extreme levels over the periods of 10/2007 to 10/2008, 3/2009 to 3/2010, and 11/2012 to 11/2013.
Does a tactical strategy actually do well in these environments as we would expect? To explore, we created a simple portfolio model:
- On a weekly basis, calculating trailing 252-21 day time-series momentum for each of the primary U.S. sectors. This method boils down to computing returns over the last year, excluding the most recent month.
- If a sector has positive momentum, keep it in the portfolio. If a sector has negative momentum, remove it from the portfolio.
- Give an equal allocation to all sectors in the portfolio.
- Apply a 25% position cap; allocate any remaining capital to the risk-free instrument.
This design creates a long-only trend-following strategy that seeks to capture market growth and avoid significant market losses.
To benchmark this strategy, we will use a 50/50 stock/bond portfolio. We believe this benchmark, over the long run, helps capture both positive and negative effects made by the tactical allocation decisions. Our expectation is that in environments with strong trends – whether positive or negative – the tactical portfolio can adjust to a position that should outperform the benchmark.
So how is trailing 1-year relative performance to this benchmark related to the trailing 1-year MDI of the sectors?

Source: Kenneth French Data Library. Calculations performed by Newfound Research. All performance is backtested and hypothetical and does not reflect the actual results attained by any individual. Performance does not reflect any management fees or transaction costs. Performance does not reflect any strategy or portfolio managed by Newfound Research.
When the blue line is above zero, the tactical strategy has outperformed the benchmark; when it is below zero, it has underperformed.
We see that not only is there a high degree of correlation between the MDI and relative performance, but that in periods when MDI was strongly negative (e.g. 5/1970, 10/1974, 10/2008), the tactical strategy outperformed significantly.
Another way to look at this data is as a scatter plot.
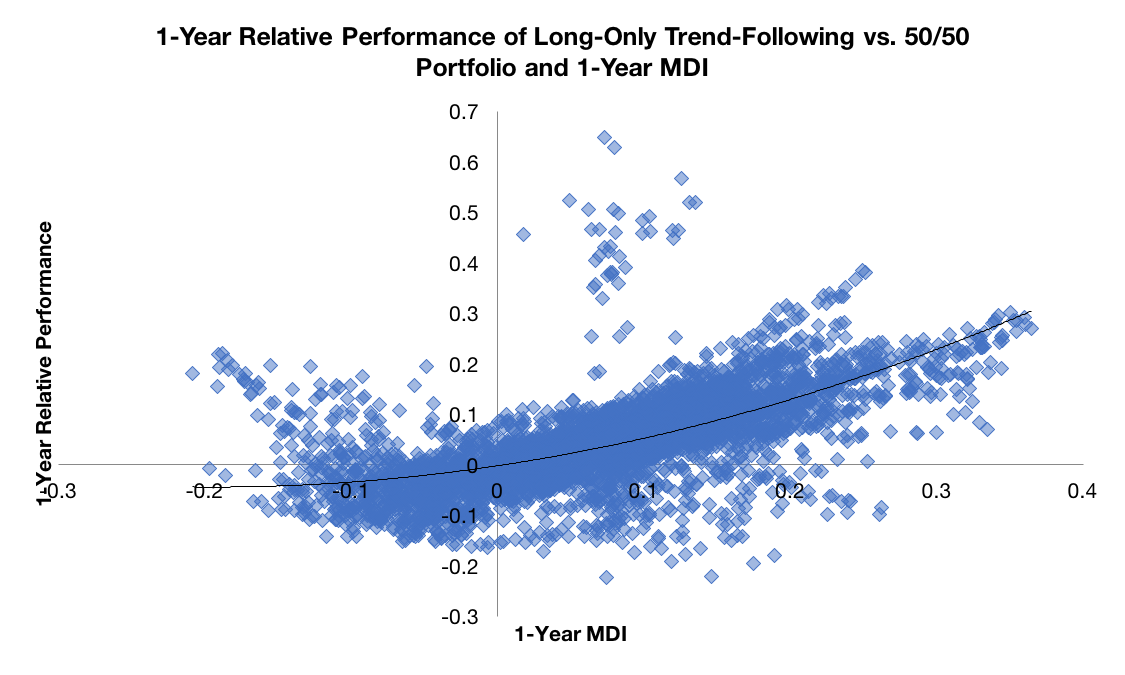
Source: Kenneth French Data Library. Calculations performed by Newfound Research. All performance is backtested and hypothetical and does not reflect the actual results attained by any individual. Performance does not reflect any management fees or transaction costs. Performance does not reflect any strategy or portfolio managed by Newfound Research.
What we see is the stereotypical smirk, or smile, of trend-following strategies. When trends are strong, either positive or negative, relative performance tends to be good. When trends are weak, relative performance dips and even turns negative as whipsaw creates losses.
We can plot the average relative performance by MDI bin to get a better view of this.
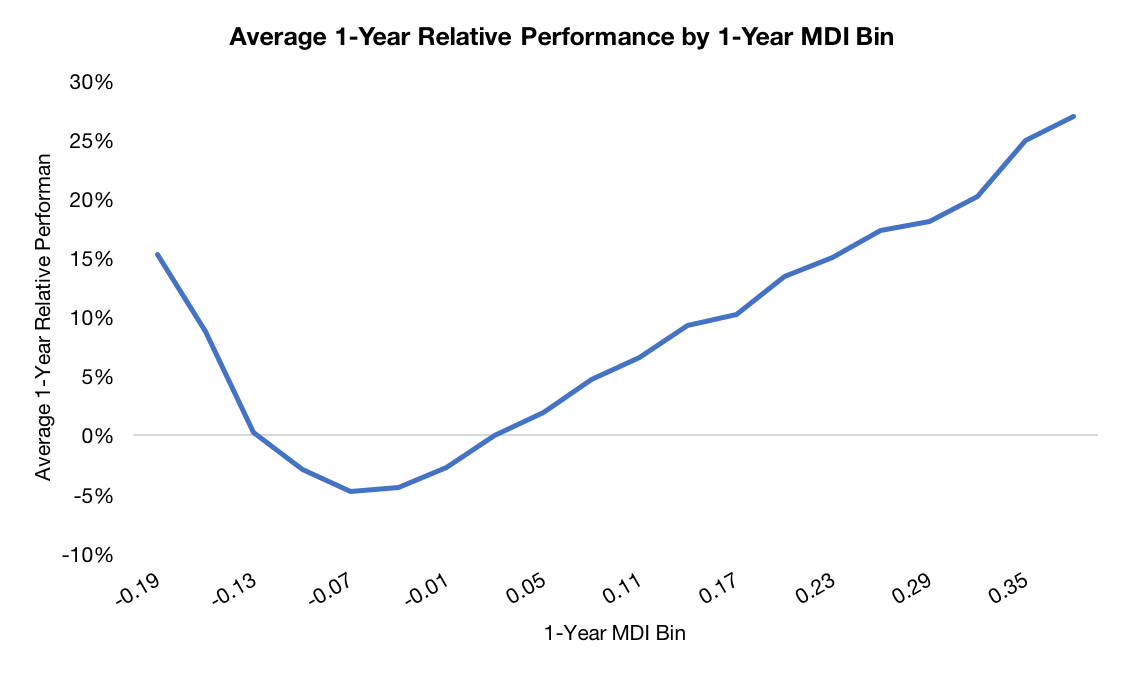
Source: Kenneth French Data Library. Calculations performed by Newfound Research. All performance is backtested and hypothetical and does not reflect the actual results attained by any individual. Performance does not reflect any management fees or transaction costs. Performance does not reflect any strategy or portfolio managed by Newfound Research.
What we see is that for low absolute MDI numbers (e.g. between -0.1 and 0.1), relative performance was not great for the trend-following strategy. When the average trend was strong, however, relative performance really took off.
We believe that MDI serves as a good gauge for how determining whether a trend-following strategy should or should not have done well. Similar to how we shouldn’t expect stocks to do well in a recession or bonds to do well when rates rise, we shouldn’t expect a trend-following strategy to perform well when there are no trends.
Nevertheless, this is exactly why trend-following is not meant to replace, but rather complement traditional means of risk management. And, for those investors that truly understand when and why trend-following should work, there is no reason it cannot be a core holding.
Copyright © Newfound Research