by Don Vialoux, Timingthemarket.ca
Observations
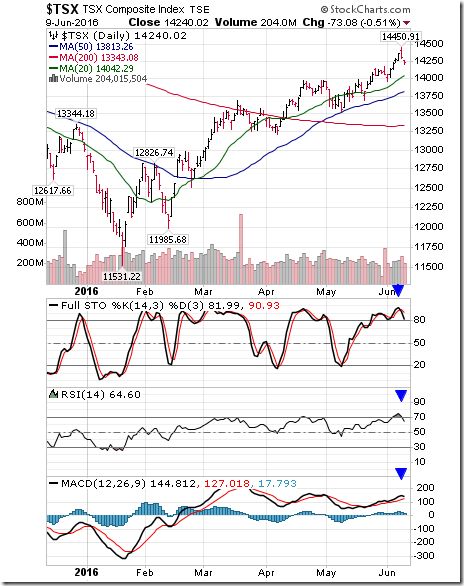
A word of caution on the Canadian equity market! Short term momentum indicators have rolled over from overbought levels at a time when the TSX Composite has a history of reaching a seasonal peak.
StockTwits Released Yesterday
U.S. oil production increases for the first time in months.
Technical action by S&P 500 stocks to Noon: Bullish. Breakouts: $HSY, $VAR, $AAL, $NLSN, $AVY, $DUK, $EIX. Breakdowns: $DIS, $BEN, $GS.
Editor’s note: After Noon, one more S&P 500 stock broke resistance: General Mills.
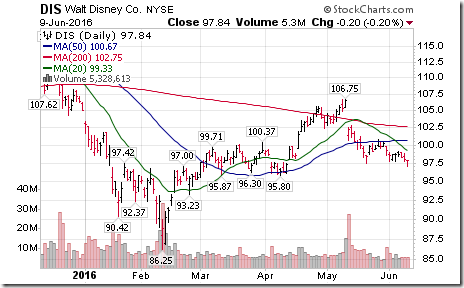
Disney (a Dow Jones Industrial stock) established an intermediate downtrend on a move below $97.51.
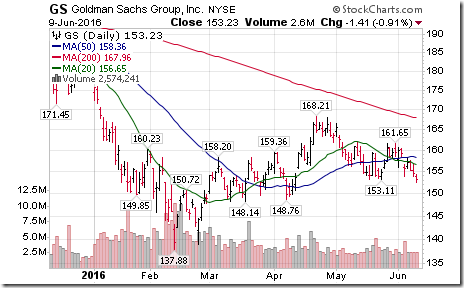
Goldman Sachs $GS (a Dow Jones Industrial stock) established an intermediate downtrend on a move below $153.11
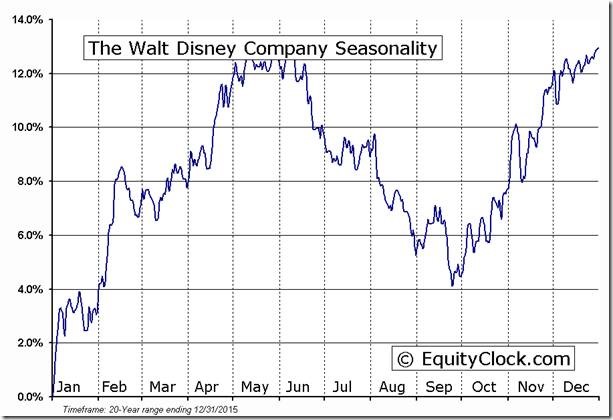
‘Tis the season for weakness in Disney $DIS until end of September.
Trader’s Corner
Daily Seasonal/Technical Equity Trends for June 9th 2016
Green: Increase from previous day
Red: Decrease from previous day
Daily Seasonal/Technical Commodities Trends for June 9th 2016
Green: Increase from previous day
Red: Decrease from previous day
Daily Seasonal/Technical Sector Trends for June 9th 2016
Green: Increase from previous day
Red: Decrease from previous day
Interesting Charts
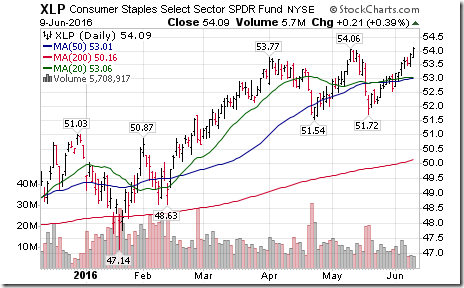
Consumer Staples SPDRs (XLP) moved above $54.06 to reach an all-time high
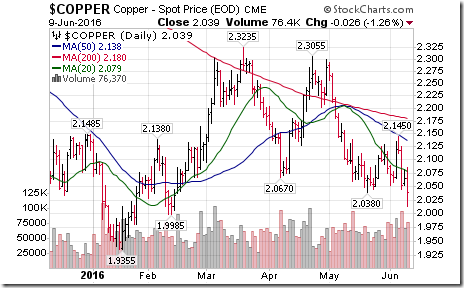
Copper dropped below $2.038 cents per lb. following a surprising surge in inventories.
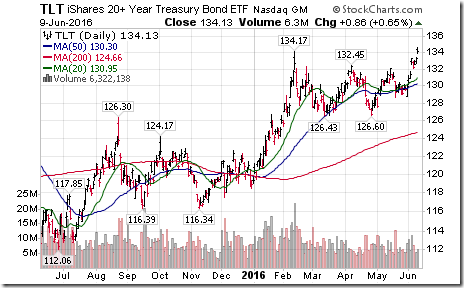
iShares long term U.S. Treasuries (TLT) broke above $134.17 to reach an all-time high
Special Free Services available through www.equityclock.com
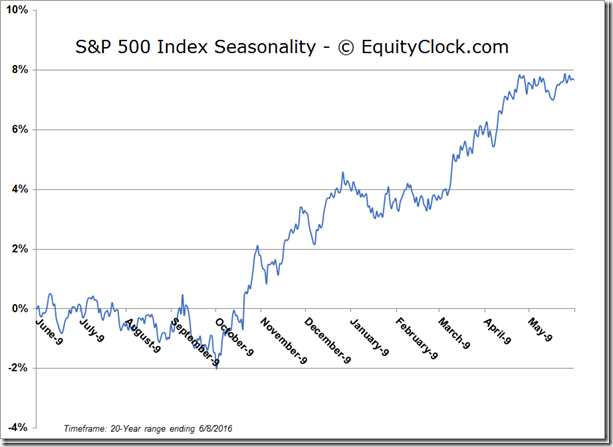
Equityclock.com is offering free access to a data base showing seasonal studies on individual stocks and sectors. The data base holds seasonality studies on over 1000 big and moderate cap securities and indices. To login, simply go to http://www.equityclock.com/charts/ Following is an example:
Editor’s Note: On average during the past 20 years, the S&P 500 Index has reached a seasonal peak today.
S&P 500 Index Momentum Barometer
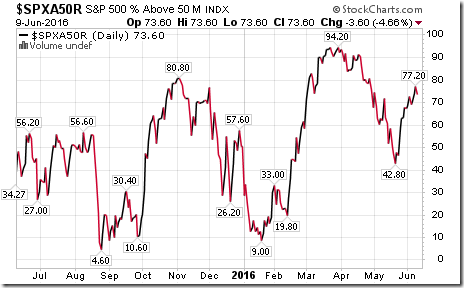
The Barometer slipped yesterday to 73.60 from 77.20. The Barometer remains intermediate overbought and showing short term signs of peaking at a time when the S&P 500 Index frequently reaches a seasonal peak.
TSX Composite Index Momentum Barometer
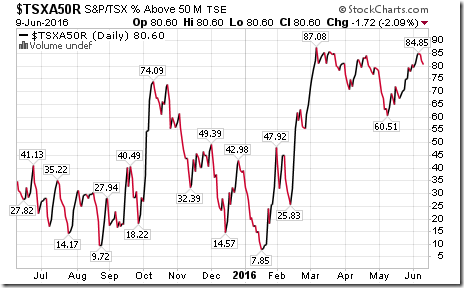
The Barometer dropped again yesterday to 80.60 from 82.32. The Barometer remains intermediate overbought and showing short term signs of rolling over from a traditional seasonal peak at this time of year.
Disclaimer: Seasonality and technical ratings offered in this report by www.timingthemarket.ca and www.equityclock.com are for information only. They should not be considered as advice to purchase or to sell mentioned securities. Data offered in this report is believed to be accurate, but is not guaranteed
Copyright © DV Tech Talk, Timingthemarket.ca


![clip_image002[13] clip_image002[13]](https://advisoranalyst.com/wp-content/uploads/2019/08/296de7da7e28c576cdf2ae09e11e127e.png)
![clip_image002[15] clip_image002[15]](https://advisoranalyst.com/wp-content/uploads/2019/08/079b72b39d7508837bb8800ef1da6d4e.png)
![clip_image002[5] clip_image002[5]](https://advisoranalyst.com/wp-content/uploads/2019/08/2abe1a1816645add424d97663ede9f33.png)
