
High-yield Bonds Still Dependent on Oil
by Anthony Valeri, Fixed Income and Investment Strategist, LPL Financial
KEY TAKEAWAYS
· High-yield bond strength has continued largely due to additional oil price gains.
· We find high-yield bonds fairly valued and see further gains as limited.
· Still, above-average yields support limited exposure while dependence on oil prices remains a risk.
High-yield has continued its run of strong performance that started in mid-February 2016, but continues to remain highly dependent on the path of oil prices. Second quarter 2016 economic growth prospects have also helped, but have taken a backseat to the impact of oil. Fair valuations, rising defaults, and continued dependency on oil suggest caution after an impressive rebound since mid-February 2016.
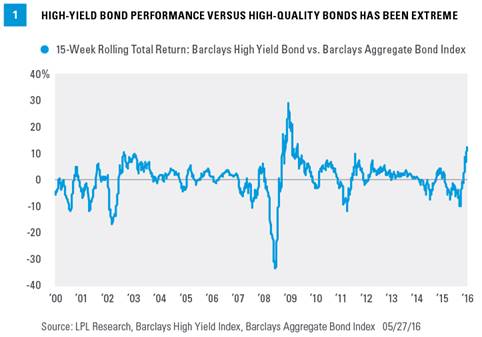
The outperformance of high-yield bonds over high-quality bonds has been notable. In the 15 weeks since high-yield bond prices bottomed on February 11, 2016, the Barclays U.S. High Yield Index has outperformed the Barclays U.S. Aggregate by 12.6%. This is the highest outperformance over any 15-week period other than the recovery from the Great Recession in 2009 [Figure 1].
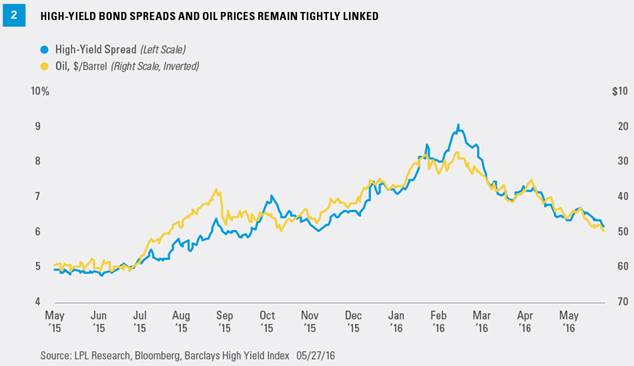
High-yield bond performance has been driven by expectations of economic improvement during the second quarter of 2016, but more importantly, by a further reduction in default fears due to the continued rebound in oil prices. High-yield bond prices and oil prices remain tightly linked [Figure 2]. The average yield advantage, or spread, of high-yield bonds to comparable Treasury bonds has declined from over 9% in mid-February to under 6%, as of May 27, 2016.
It is no surprise that the high-yield energy sector has led the rebound.[1] High-yield energy’s spread, or yield advantage over comparable Treasury bonds, declined from a peak of 19.6% on February 11, 2016, to 8.6% as of May 27, 2016. A spread under 10% for high-yield energy means that sector is no longer distressed, an encouraging signal that indicates investors see energy-related defaults declining.
DECELERATING DEFAULTS
The high-yield energy sector is no longer in distressed territory, suggesting defaults may decelerate and the worst may be behind the high-yield bond sector. Based on our research, current yield spreads imply a forward one-year default rate of 4.7% for the overall high-yield market, 7.9% for the high-yield energy sector, and 4.2% for high-yield excluding the energy sector. We believe these numbers are roughly fair but provide little room for error if defaults do not decelerate, especially among energy-related issuers.
One reason the market is indicating a lower future default rate is that many energy-related defaults may have already occurred or may be occurring very soon. Markets are forward looking; therefore, while defaults may increase over the short term, markets indicate an expectation for them to slow over the next year. Should a deceleration in the rise of the default rate occur, it may also indicate that the bulk of the defaults have already transpired.
A DEFAULT SLOWDOWN IS MOSTLY PRICED IN
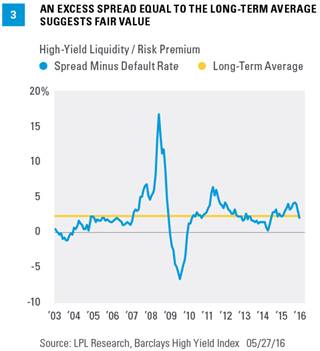
A current yield spread of near 6% represents a high-yield market that is approximately fairly valued, and potentially slightly expensive given the pace of defaults. Measuring how much current yield spreads compensate investors for expected risks can help quantify fair value. High-yield spreads compensate investors not only for default risks but for liquidity and other risks that can be termed the “excess spread.” Looking back at market performance over default cycles to obtain the historical excess spread and comparing that to today’s level can give an indication of how over- or undervalued the market may be. As of the end of April 2016, the high-yield market’s excess spread was almost exactly equal to its historical average, indicating roughly fair valuations [Figure 3].
SCENARIO ANALYSIS
High-yield’s near-term outlook remains highly dependent on the price of oil. A material downward move in the price of oil could cause weakness in high-yield. Similarly, if oil were able to sustain a continued move higher, high-yield bond prices could improve further. Having a single variable act as such a powerful driver of investment creates an added risk for high-yield investors.
Still, in a low-yield world where many segments of the bond market are historically expensive, a small allocation to high-yield bonds can add value. Interest income can be a powerful driver of return in what we see as a range bound interest rate environment. Scenario analysis can help assess what may be in store for high-yield bonds [Figure 4].
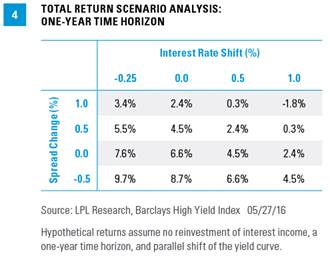
Figure 4 indicates that the one-year total return for the Barclays U.S. High Yield Index, assuming unchanged spreads and a 0.5% increase in interest rates, is 4.5%, a respectable measure in our current low-yield/low-return environment. Comparisons to the broader bond market can also be helpful: a 0.5% increase in interest rates would result in a 0.4% one-year total return for the Barclays U.S. Aggregate Index.
CONCLUSION
We find high-yield bonds fairly valued and see further gains as limited. Still, investors may benefit from a small allocation to high-yield, whose above-average interest income can be beneficial in a low-yield world. The tight relationship between oil and high-yield has been a benefit recently, but could turn and remains a risk due to oil’s outsized influence on the sector—a reason for caution and limited exposure.
IMPORTANT DISCLOSURES
The opinions voiced in this material are for general information only and are not intended to provide specific advice or recommendations for any individual. To determine which investment(s) may be appropriate for you, consult your financial advisor prior to investing. All performance reference is historical and is no guarantee of future results. All indexes are unmanaged and cannot be invested into directly.
The economic forecasts set forth in the presentation may not develop as predicted and there can be no guarantee that strategies promoted will be successful.
Bonds are subject to market and interest rate risk if sold prior to maturity. Bond values and yields will decline as interest rates rise, and bonds are subject to availability and change in price.
Government bonds and Treasury bills are guaranteed by the U.S. government as to the timely payment of principal and interest and, if held to maturity, offer a fixed rate of return and fixed principal value. However, the value of fund shares is not guaranteed and will fluctuate.
High-yield/junk bonds (grade BB or below) are not investment grade securities, and are subject to higher interest rate, credit, and liquidity risks than those graded BBB and above. They generally should be part of a diversified portfolio for sophisticated investors.
Commodity-linked investments may be more volatile and less liquid than the underlying instruments or measures, and their value may be affected by the performance of the overall commodities baskets as well as weather, geopolitical events, and regulatory developments.
INDEX DESCRIPTIONS
The Barclays U.S. Aggregate Bond Index is a broad-based flagship benchmark that measures the investment-grade, U.S. dollar-denominated, fixed-rate taxable bond market. The index includes Treasuries, government-related and corporate securities, MBS (agency fixed-rate and hybrid ARM pass-throughs), ABS, and CMBS (agency and non-agency).
The Barclays U.S. Corporate High Yield Index measures the market of USD-denominated, noninvestment-grade, fixed-rate, taxable corporate bonds. Securities are classified as high yield if the middle rating of Moody’s, Fitch, and S&P is Ba1/BB+/BB+ or below, excluding emerging market debt.
The Barclays U.S. Corporate High Yield Energy Index covers the universe of fixed rate, non-investment grade debt. Eurobonds and debt issues from countries designated as emerging markets (sovereign rating of Baa1/BBB+/BBB+ and below using the middle of Moody’s, S&P, and Fitch) are excluded, but Canadian and global bonds (SEC registered) of issuers in non-EMG countries are included. Original issue zeroes, step-up coupon structures, 144-As and pay-in-kind bonds (PIKs, as of October 1, 2009) are also included.
This research material has been prepared by LPL Financial.
To the extent you are receiving investment advice from a separately registered independent investment advisor, please note that LPL Financial is not an affiliate of and makes no representation with respect to such entity.
Copyright © LPL Financial