
What's the Outlook for U.S. Equities as S&P 500 Re-tests New Highs?
For this week’s edition of the SIA Equity Leaders Weekly, we are going to revisit the US Equity Markets as the S&P 500 looks to re-test the prior highs reached late last year and from August of 2015. US Equity asset class is currently in the #2 spot of SIA’s Asset Class rankings as the top equity asset class so it is important to keep an eye on key levels that may be tested for this area. We will also take a look at what index is predominantly driving the strength within the US Equity Asset Class. The last time we looked at the comparison chart of the Nasdaq Composite Index (NASD.I) vs. the S&P 500 index (SPX.I) back on Dec 31 2015, we saw that the Nasdaq had performed vastly better than the S&P 500 from the beginning of 2009 to the end of 2015. But has anything changed in leadership within the US Equity Asset class since the end of 2015?
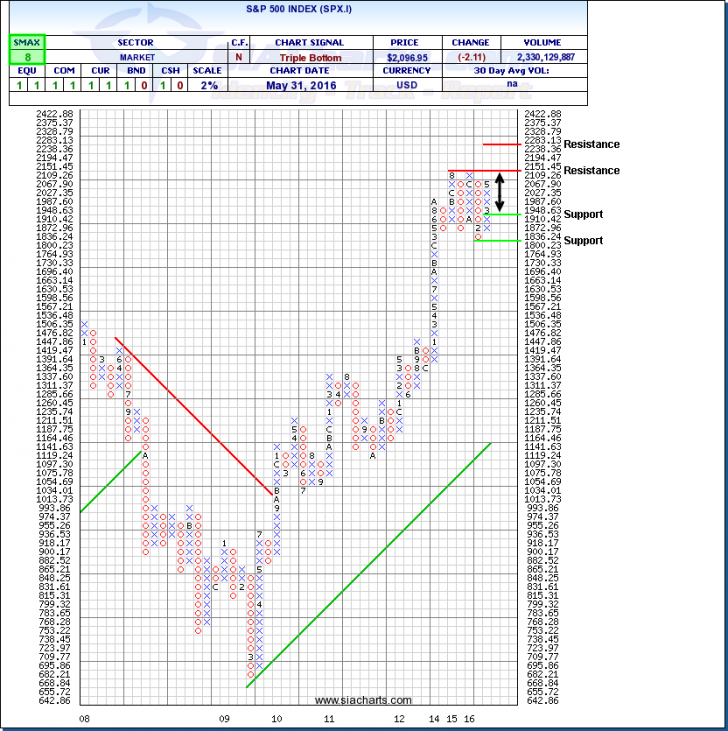
S&P 500 Index (SPX.I)
Let’s first take a look at the S&P 500 Index (SPX.I). In looking at the chart of (SPX.I), we see that it has been in a sideways trading range since 2014 and this sideways trend continues to be intact. The S&P 500 has recovered quite nicely since the early 2016 market turbulence we had experienced in January/February and is approaching its all-time high reached back in Dec 2015. This is due in large part to the continued dovish stance by the US Federal Reserve and their reluctance to increase interest rates (at least not yet) which has calmed the markets of late. It will be interesting to see if the S&P 500 pulls back on the near-term resistance level at 2151.45 and continues it’s sideways trading range or if it can break above the 2151.45 level onto to new highs.
With the US Fed meeting scheduled for later this month and their decision on whether to begin increasing interest rates or remain in its dovish approach, this may have a large impact of which direction the S&P 500 takes in the coming weeks. Should the S&P 500 pull back, the next level of support 1910.42 and, below that, around the 1800 level. If it is able to break above the near term resistance level of 2151.45, the next level of resistance can be found at the 2283 level. The S&P 500 currently has an SMAX of 8 out of 10.
Click on Image to Enlarge
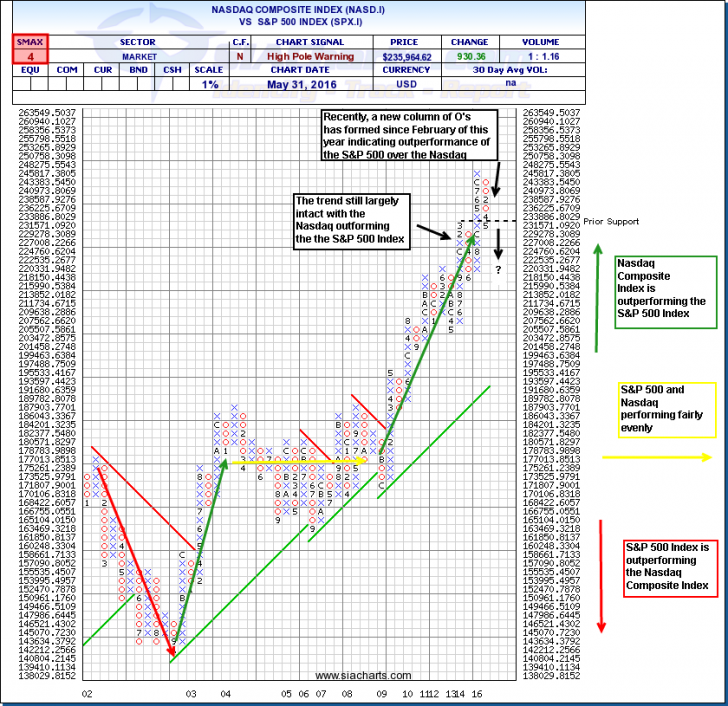
Nasdaq Composite Index (NASD.I) vs. S&P 500 Index (SPX.I)
After looking at the chart of the S&P 500 Index, let’s now draw our attention to the comparison chart of the Nasdaq and the S&P 500 Index (the US Market’s two major indices). As mentioned above, the last time we looked at this comparison chart was back in Dec of 2015 which saw a vast outperformance in favor of the Nasdaq vs. the S&P 500. As you can see in the comparison chart, the Nasdaq won the relative strength battle over the S&P 500 since the spring of 2009 for the most part. But since the beginning of this year, we see a column of O’s has formed and the first support level for the Nasdaq has been broken. In this chart, a rising column of X’s means that the numerator of this comparison chart, NASD.I, is outperforming the S&P 500. A descending column of O’s, indicates the denominator of the comparison, SPX.I, his outperforming over the Nasdaq. Hence, with the recent column of O’s that has formed since February of this year, this indicates that the S&P 500 has outperformed the Nasdaq on a relative basis.
Year to date, the S&P 500 is up a little more than 4% while the Nasdaq is up marginally up at just under 1%. Is there perhaps an early indication of a change in leadership within the US Equity Market? With an Comparison SMAX score of 4 in the comparison chart, this indicates there is some weakness on a relative strength basis for the Nasdaq vs. the S&P 500. The last time we looked at the comparison chart in December, the Comparison SMAX score was 6 in favor of NASD.I, hence, we are seeing some deterioration in the comparison score for the Nasdaq vs. the S&P 500 of late in favor of the S&P which we haven't really seen in while besides briefly in June of 2014.
If you draw your attention the Market Sector Report found in “Stock Sectors” subtab within our “Reports” tab on SIACharts, you can get an excellent understanding of what sectors are really driving the strength for the markets. To take advantage of the power of relative strength, it can be vital to first identify the strongest sectors within the market before you identify your individual stock selections. In looking at some of the various sectors which comprise the Nasdaq, we can see that in SIA’s stock sectors tab, the Internet Sector currently ranks in the Neutral Zone in the #11 spot within the Market Sector Report. At the end of December, the Internet Sector rank in the Favored Zone at the # 4 position. Another example of note is the Drugs sector. It currently ranks in the Unfavored Zone of the Market Sector Report in the #19 spot. Back in Dec 31, this sector was positioned in the Neutral Zone at the #10 spot. Hence, we have seen a deterioration of relative strength of these two Nasdaq oriented sectors while non technology/biotechnology sectors such as Leisure and Food/Beverages sit at the top of the report. It is a bit early to tell if the longer term trend has changed in favor of the S&P 500 over the Nasdaq, but paying attention to SIA’s Market Sector Report can be crucial in understanding where the strength is coming from so you can position yourself with the strength of the markets. The most effective way to mitigate risk is not just by identifying which asset class to look at, but also in identifying which sectors within that asset class you should be looking at. With the last step in identifying the strongest individual securities, within those strong sectors of that asset class.
Click on Image to Enlarge
SIACharts.com specifically represents that it does not give investment advice or advocate the purchase or sale of any security or investment. None of the information contained in this website or document constitutes an offer to sell or the solicitation of an offer to buy any security or other investment or an offer to provide investment services of any kind. Neither SIACharts.com (FundCharts Inc.) nor its third party content providers shall be liable for any errors, inaccuracies or delays in content, or for any actions taken in reliance thereon.
For a more in-depth analysis on the relative strength of the equity markets, bonds, commodities, currencies, etc. or for more information on SIACharts.com, you can contact our customer support at 1-877-668-1332 or at siateam@siacharts.com.
Copyright © SIACharts.com