by Don Vialoux, Timingthemarket.ca
Mr. Vialoux is scheduled this evening to appear on BNN’s Market Call Tonight
Pre-opening Comments for Tuesday May 17th
U.S. equity index futures were lower this morning. S&P 500 futures were down 4 points in pre-opening trade.
Index futures moved lower following release of economic news at 8:30 AM EDT. Consensus for April Consumer Prices was an increase of 0.3% versus a gain of 0.1% in March. Actual was up 0.4%. Excluding food and energy, consensus for April Consumer Prices was an increase of 0.2% versus a gain of 0.1% in March. Actual was an increase of 0.2%. Consensus for April Housing Starts was 1,135,000 units versus 1,089,000 in March. Actual was 1,172,000 units
Home Depot eased $0.59 to $134.75 despite reporting higher than consensus first quarter earnings and revenues.
TJX gained $2.96 to $78.15 after reporting higher than consensus first quarter earnings and revenues.
Methanex added $0.56 to US $30.11 after Raymond James upgraded the stock to Strong Buy from Outperform.
EquityClock’s Daily Market Comment
Following is a link:
http://www.equityclock.com/2016/05/16/stock-market-outlook-for-may-17-2016/
Note seasonality charts on Autos & Components, Total Vehicle Sales and Empire State Manufacturing Index
Daily Observation
Gains recorded by broadly based equity indices yesterday partially recovered losses recorded on Friday. Net result: technical scores were only slightly changed yesterday.
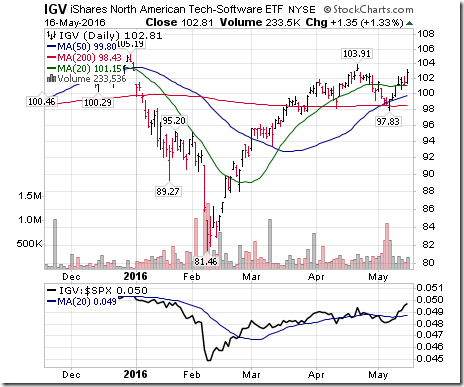
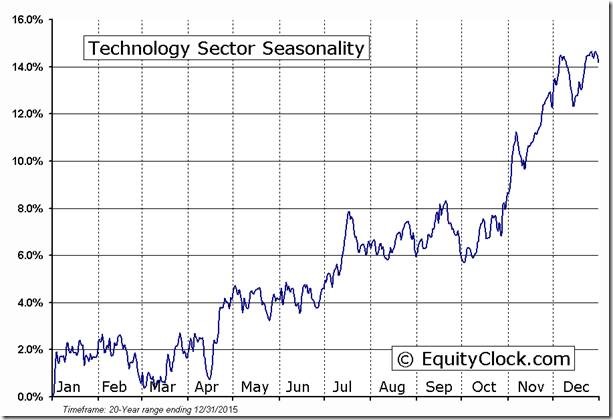
Technology finally started to wake up during one of its two periods of seasonal strength. Notable was strength in semiconductor and software stocks.
StockTwits Released Yesterday @EquityClock
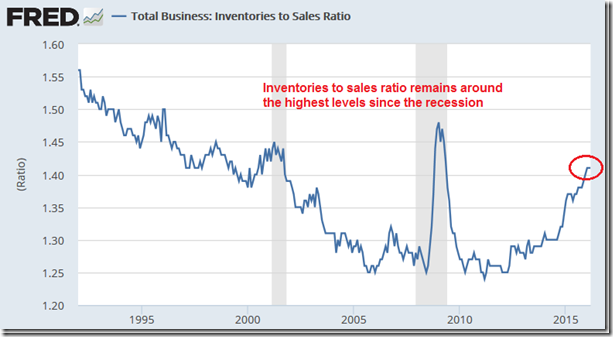
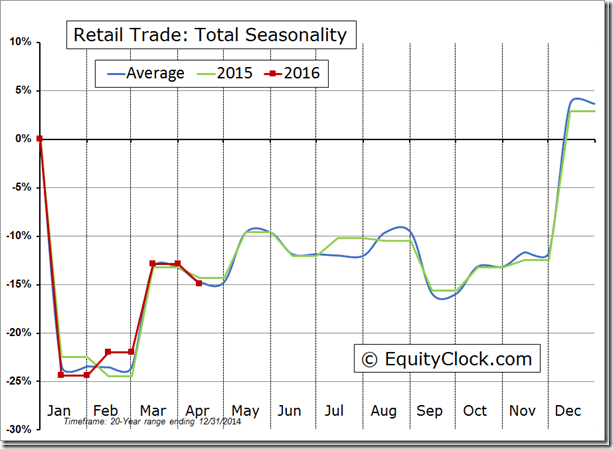
While retail sales are showing strength, so are inventory levels, resulting in margin compression.
Technical action by S&P500 stocks to 10:10 AM: Quiet. One intermediate breakdown: $CBS. No breakdowns.
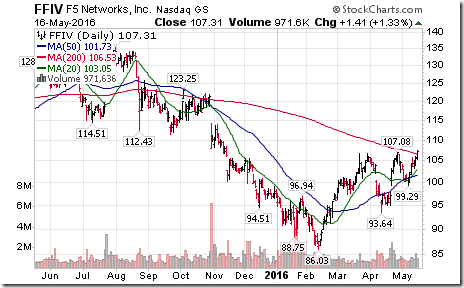
Editor’s Note: After 10:10 AM EDT, only one stock broke resistance: F5 Networks. None broke intermediate support.
Nice breakout by F5 Network $FFIV above resistance at $107.08 to extend an uptrend.
Finally, selected stocks in the technology sector (period of seasonal strength April 15-July 17) have surfaced $FFIV
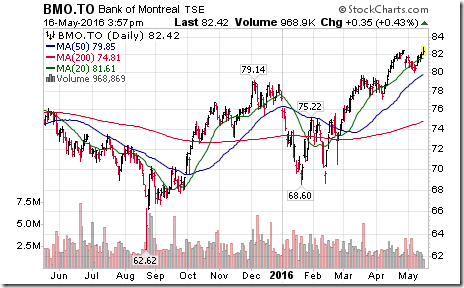
Pleasant technical surprise by $BMO.CA! Broke to an all-time high on a move above $56.47.
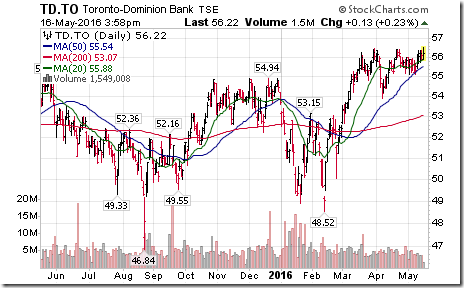
$TD.CA also moved to an all-time high on a move above $56.47,
Trader’s Corner
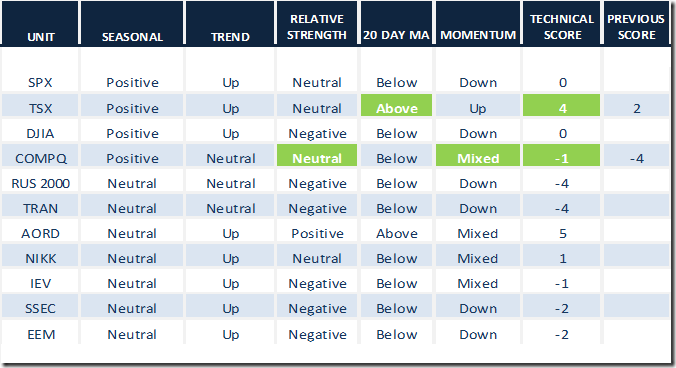
Daily Seasonal/Technical Equity Trends for May 16th 2016
Green: Increase from previous day
Red: Decrease from previous day
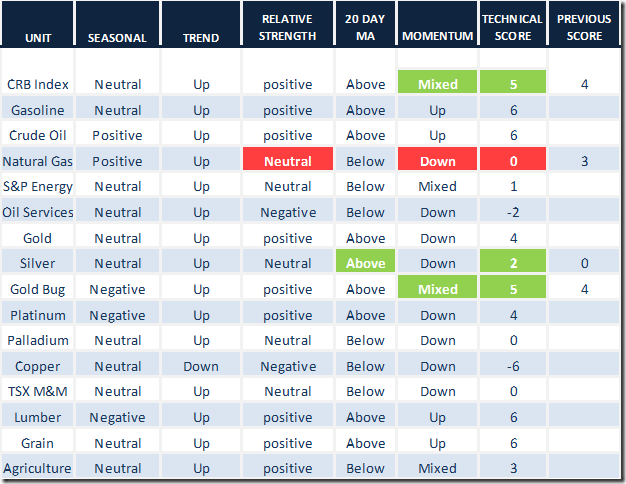
Daily Seasonal/Technical Commodities Trends for May 16th 2016
Green: Increase from previous day
Red: Decrease from previous day
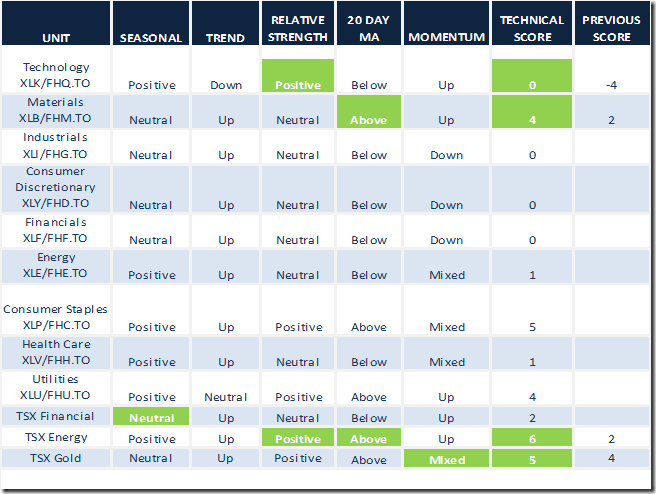
Daily Seasonal/Technical Sector Trends for March May 16th 2016
Green: Increase from previous day
Red: Decrease from previous day
Special Free Services available through www.equityclock.com
Equityclock.com is offering free access to a data base showing seasonal studies on individual stocks and sectors. The data base holds seasonality studies on over 1000 big and moderate cap securities and indices. To login, simply go to http://www.equityclock.com/charts/ Following is an example:
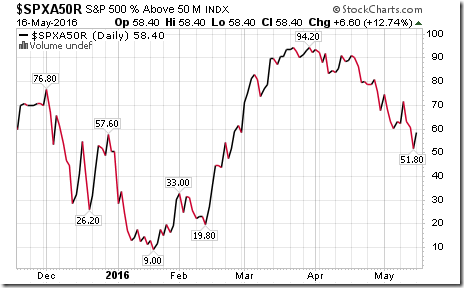
S&P 500 Momentum Barometer
The Baromoter recovered 6.60 to 58.40. The Barometer remains intermediate overbought and trending down.
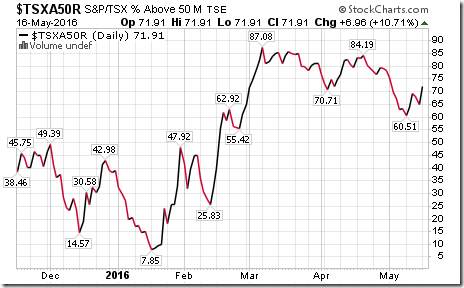
TSX Composite Momentum Barometer
The Barometer gained 6.96 to 71.91. The Barometer remains intermediate overbought and trending down.
Keith Richards’ Blog
Today’s blog covers the challenge faced by Canadian investors who buy US stocks. Follow this link to read some thoughts on where the Loonie/USD may be headed: http://www.valuetrend.ca/currency-conundrum/
Mark Leibovit’s Weekly Radio Show
WALL STREET RAW RADIO – MAY 14, 2016 WITH MARK LEIBOVIT, SINCLAIR NOE AND HARRY BOXER:
Mark Leibovit Comment
DBA – Powershares DB Agricultural ETF:
The ETF seeks to track the price and yield performance, before fees and expenses, of the Deutsche Bank Liquid Commodity Index – Optimum Yield Agriculture Excess Return. The index is a rules-based index composed of futures contracts on some of the most liquid and widely traded agricultural commodities – corn, wheat, soy beans and sugar. The index is intended to reflect the performance of the agricultural sector.
This video demonstrates the good correlation (up and down) of my Leibovit Volume Reversal in all time frames shown – daily, weekly and monthly. As a reminder, I used the 5/3/3 stochastic to help confirm an uptrend or downtrend.
Disclaimer: Seasonality and technical ratings offered in this report by www.timingthemarket.ca and www.equityclock.com are for information only. They should not be considered as advice to purchase or to sell mentioned securities. Data offered in this report is believed to be accurate, but is not guaranteed
Copyright © DV Tech Talk, Timingthemarket.ca


