by Don Vialoux, Timingthemarket.ca
StockTwits Released Yesterday @equityclock.com
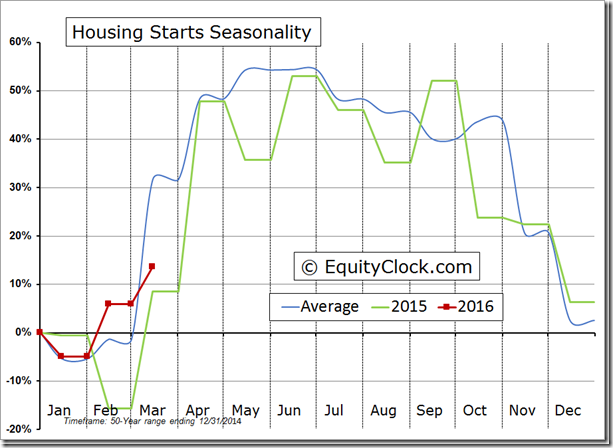
Housing starts well below average for March, raising concerns pertaining to the Spring selling season.
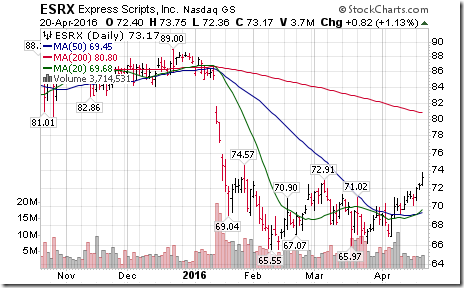
Technical action by S&P 500 stocks to 10:15: Quietly bullish. Breakouts: $GME $BBT $MS $ESRX $FMC
Editor’s Note: After 10:15 AM EDT, another four S&P 500 stocks broke resistance: ADM, LM, RHT and PNC. No S&P 500 stock broke support.
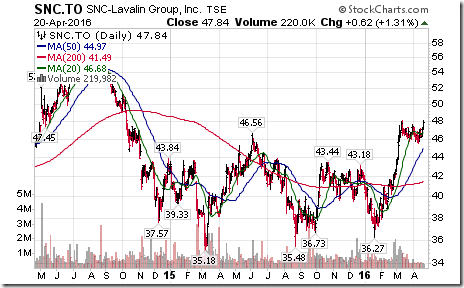
Nice breakout by SNC-Lavalin $SNC.CA above $48.09 to an 18 month high extending an intermediate uptrend
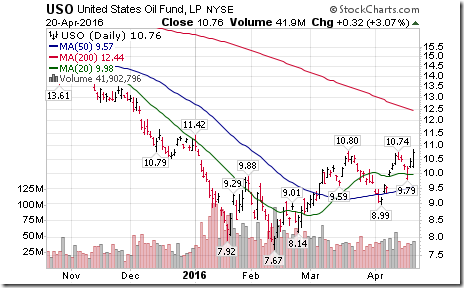
Nice breakout by crude oil ETN $USO above $10.80 to a 5 month high extending an intermediate uptrend.
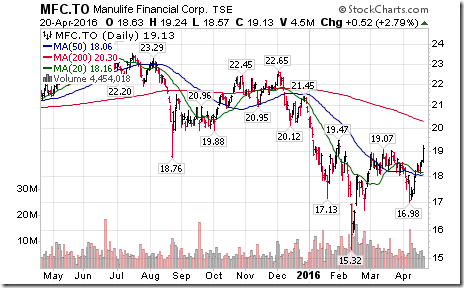
Nice breakout by Manulife $MFC.CA above $19.07 to complete a reverse head and shoulders pattern!
Trader’s Corner
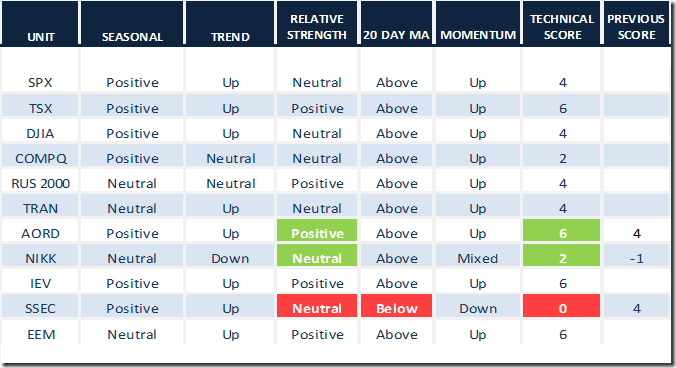
Daily Seasonal/Technical Equity Trends for April 20th 2016
Green: Increase from previous day
Red: Decrease from previous day
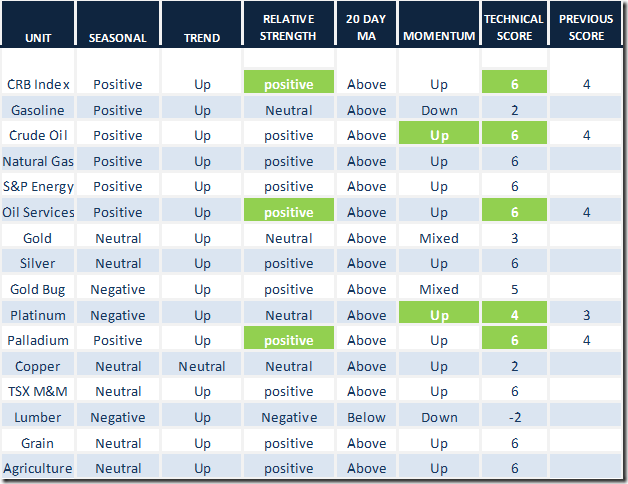
Daily Seasonal/Technical Commodities Trends for April 20th 2016
Green: Increase from previous day
Red: Decrease from previous day
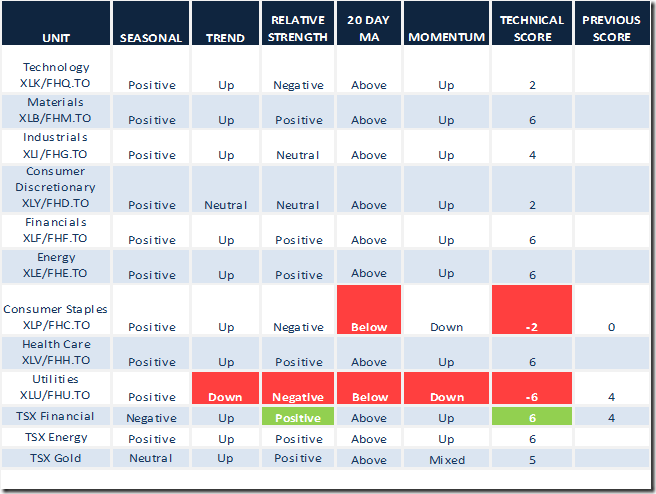
Daily Seasonal/Technical Sector Trends for March April 20th 2016
Green: Increase from previous day
Red: Decrease from previous day
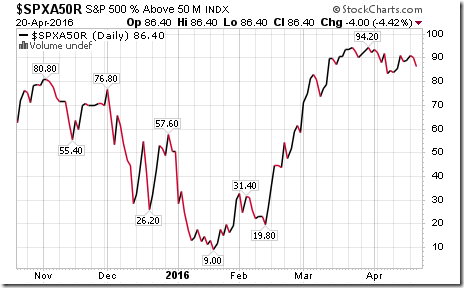
S&P 500 Momentum Barometer
The Barometer dropped 4.00% to 86.40% yesterday mainly due to drops by utilities and consumer staple stocks below their 50 day moving average. The Barometer remains intermediate overbought and showing early signs of rolling over.
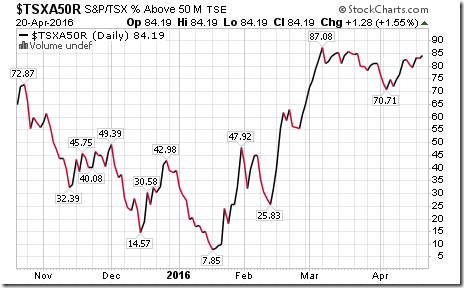
TSX Composite Momentum Barometer
The Barometer recovered 1.28% to 84.19% yesterday. The Barometer remains intermediate overbought.
Interesting Charts
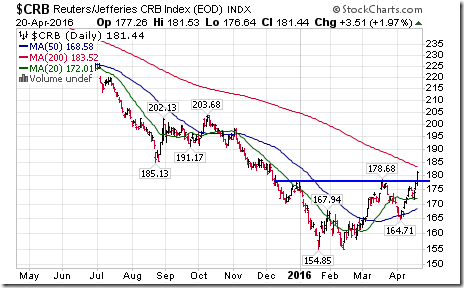
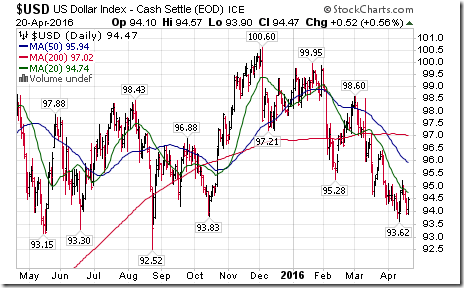
The CRB Index completed a reverse head & shoulders pattern yesterday by moving above 178.68. Weakness in the U.S. Dollar Index is having a positive impact.
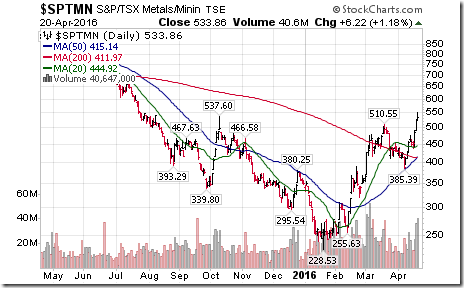
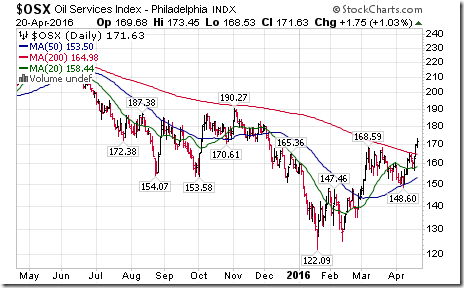
A breakout by the CRB Index triggered significant upside technical action in commodity sensitive stocks and ETFs:
Nice breakout by the S&P/TSX Metals & Mining Index
Nice breakout by the Philadelphia Oil Services Index
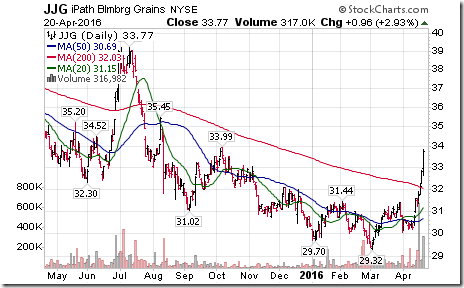
Continuing strength in the Grain ETN
Nice breakout by the Fertilizer ETF
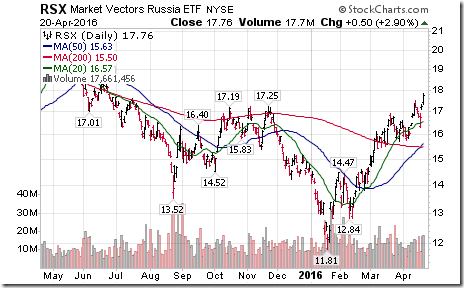
Nice breakout by the energy sensitive Russian ETF
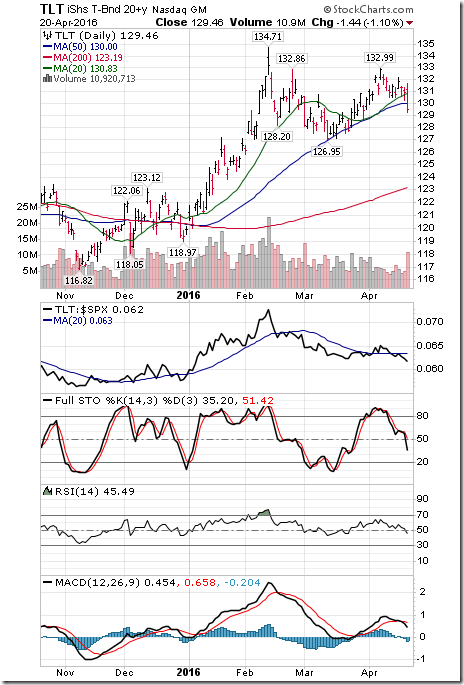
However, higher commodity prices prompted interest rate sensitive bonds and related sectors to come under profit taking pressure.
Price of the long term Treasury ETF dropped sharply. TLT broke below its 20 day moving average and its short term momentum indicators are trending down.
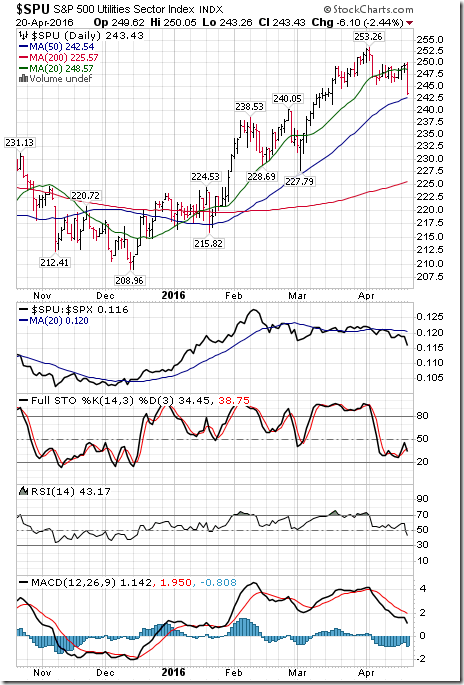
Technical deterioration by the S&P Utilities Index was significant. Yesterday, the Index broke support at 245.36 to establish a short term downtrend, began to underperform the S&P 500 Index, broke below its 20 day moving average and recorded short term momentum downtrends.
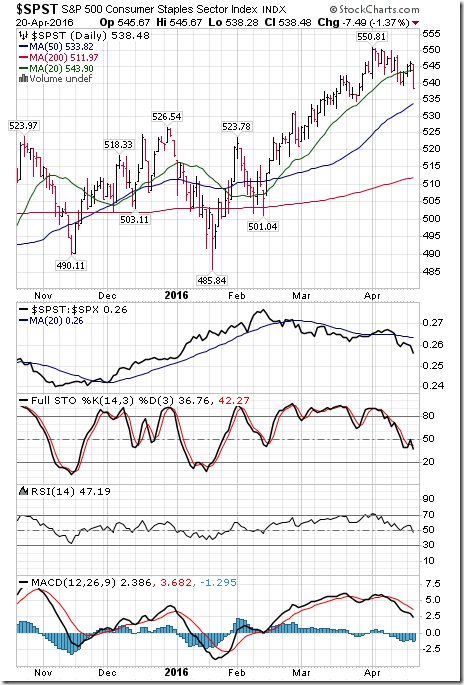
The S&P Consumer Staples Index also recorded technical deterioration.
Special Free Services available through www.equityclock.com
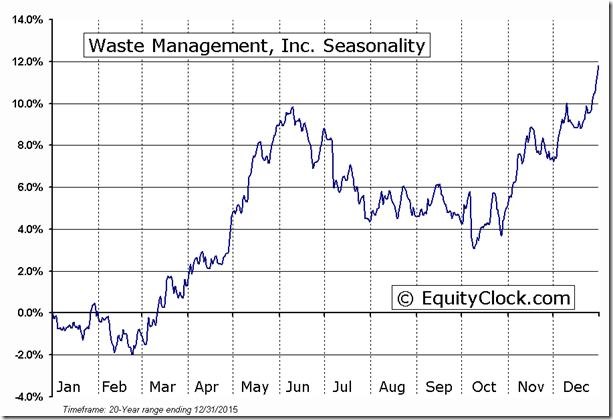
Equityclock.com is offering free access to a data base showing seasonal studies on individual stocks and sectors. The data base holds seasonality studies on over 1000 big and moderate cap securities and indices. To login, simply go to http://www.equityclock.com/charts/ Following is an example:
Keith Richards’ Blog
What VIX trends might be telling us!
Following is a link:
http://www.valuetrend.ca/what-vix-trends-might-be-telling-us/
Disclaimer: Seasonality and technical ratings offered in this report by www.timingthemarket.ca and www.equityclock.com are for information only. They should not be considered as advice to purchase or to sell mentioned securities. Data offered in this report is believed to be accurate, but is not guaranteed
Copyright © DV Tech Talk, Timingthemarket.ca


![clip_image018[1] clip_image018[1]](https://advisoranalyst.com/wp-content/uploads/2019/08/bb8950abf2a58833d532dd941e4387ae-1.png)
