Taking stock after the rally
by Burt White, Chief Investment Officer, LPL Financial
KEY TAKEAWAYS
· The latest rally has been driven by many factors and has pushed the S&P 500 to within 2.4% of its all-time high.
· Here we assess the likelihood that the rally continues from this point forward, and, if so, how much further it might have
to go.
· Historical stock market performance after sharp rallies does not sway us from our expectations for mid-single-digit returns for
stocks in 2016.
Stocks have had quite a nice run. Since the February 11, 2016 lows the S&P 500 has gained 14%. The rally has been driven by many factors — chief among them, better U.S. economic data, higher oil prices, the Federal Reserve’s (Fed) slower rate hike timetable, increased confidence in China, and more stimulus from overseas central banks. These factors have enabled stocks to trade more on fundamentals than fear, and have pushed the S&P 500 to just 2.4% below its all-time high. Here we assess the likelihood that the rally continues from this point forward, and, if so, how much further it might have to go.
Rare Rally
The 14% rally in 9 weeks is not completely unprecedented, but it is rare. Based on weekly data back to 1950, just 1.4% of all the 9-week periods saw the S&P 500 gain more than 14%. So on average, we have less than one of these each year. What is interesting about the history of these sharp rallies is that most of them occurred early in business cycles, shortly after recessions, including 1982, 1991, and 2009–10. Several others could be characterized as crisis recovery periods, including following the 1987 crash and the latest downdraft. We also saw several of these rallies during the tech boom of the late 1990s [Figure 1].
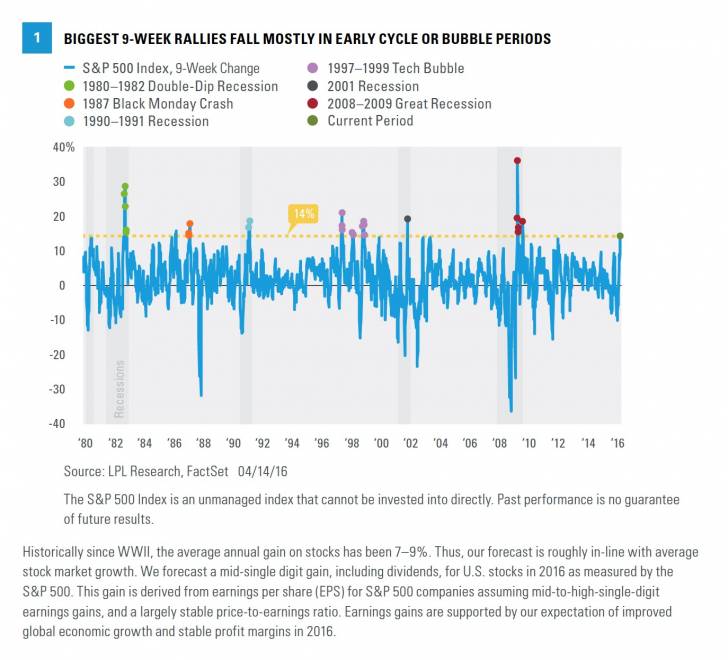
We do not believe the U.S. economy is in the early part of the cycle. Nearing the seventh year of the economic expansion, and based on the business cycle indicators we follow, we believe we are moving into the cycle’s latter stages. That suggests tempering enthusiasm for stocks following recent gains. Some may view a stock market that has more than tripled since 2009 amid unprecedented Fed policies as a bubble, which would certainly be cause for some caution. (We do not share this view at this point but acknowledge the potential for an inflation problem in the years ahead.) Finally, we do not think we just experienced a full-blown, non-recessionary crisis like the 1987 crash or even the 2011 debt ceiling debacle, although it may have felt as bad.
Historically since WWII, the average annual gain on stocks has been 7 - 9%. Thus, our forecast is roughly in-line with average stock market growth. We forecast a mid-single digit gain, including dividends, for U.S. stocks in 2016 as measured by the S&P 500. This gain is derived from earnings per share (EPS) for S&P 500 companies assuming mid-to-high-single-digit earnings gains, and a largely stable price-to-earnings ratio. Earnings gains are supported by our expectation of improved global economic growth and stable profit margins in 2016.
Bottom line, we would characterize this latest volatile market action as more of a mid-to-late cycle recession scare, and we expect the low-return environment stocks have experienced may to continue.
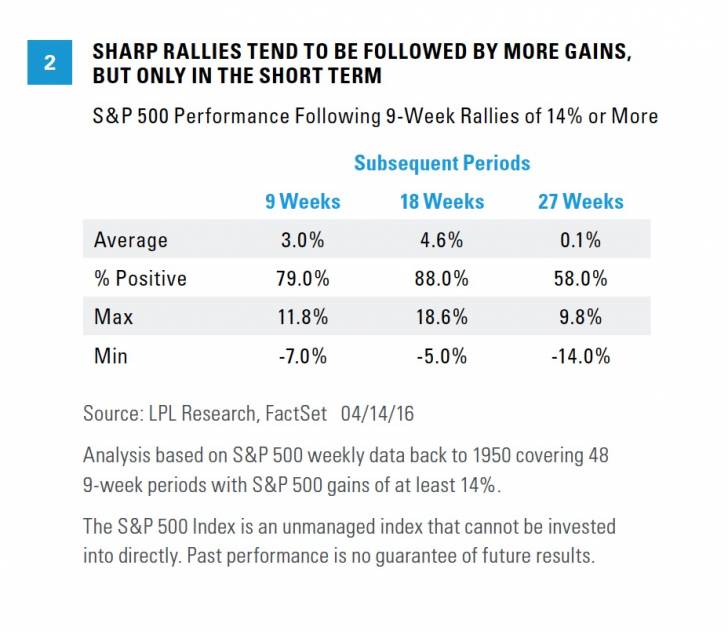
The logical next question is: What have stocks done after these sharp rallies? The answer is mixed. Figure 2 shows that after a 9-week rally of 14% or more, the S&P 500 averages another 3–5% gain over the next 9 and 18 weeks and is higher 79% and 88% of the time, respectively. This is clearly good news for stocks; however, it should be tempered by business cycle considerations. Many of these periods were early cycle when stocks were embarking on significant, extended bull market rallies, or in the bubble period of the late 1990s.
Also note that stock market gains tapered off over the 27-week periods following these sharp rallies, with the S&P 500 roughly flat on average and gains only slightly more than half the time. Each period is different, but this may mean that we could go a bit higher before correcting again and possibly end the year with just a modest gain, as we forecast in Outlook 2016: Embrace the Routine.
Valuations creeping up
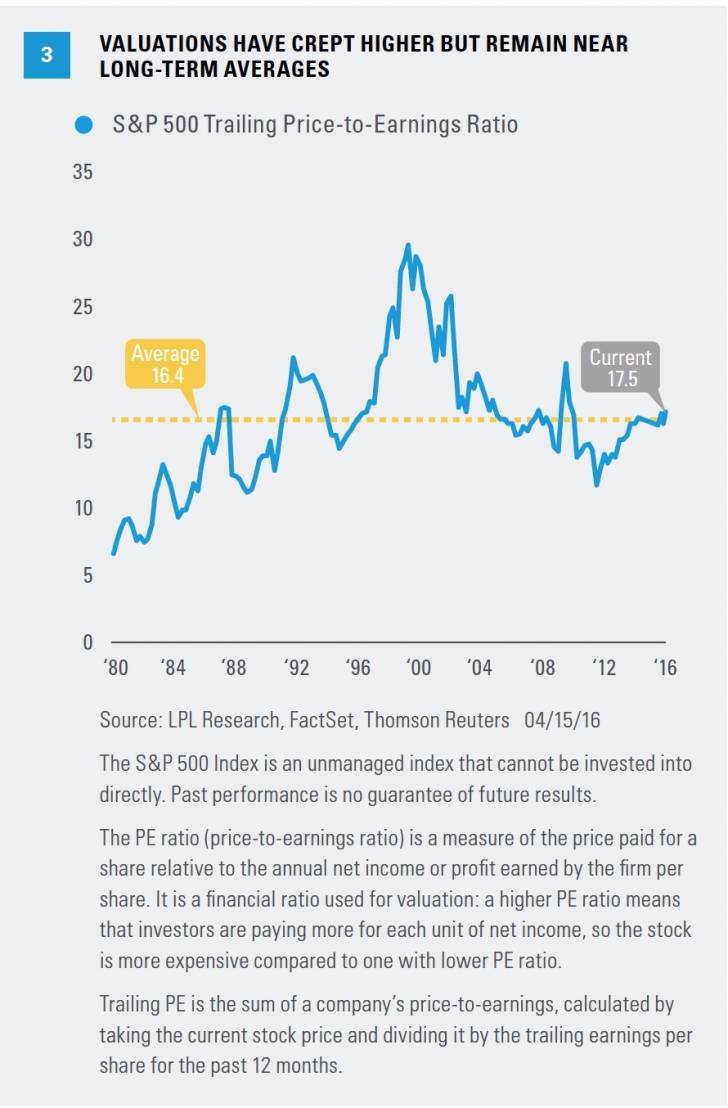
It is logical to think stocks are expensive after such a sharp rally, but we still characterize valuations as fair. Price-to-earnings ratios (PE) remain near long-term averages, and interest rates are low (interest rates support stock valuations by making bonds less competitive relative to stocks). On a trailing 12-months basis, recent gains have pushed the S&P 500 PE up to 17.5 [Figure 3], about 1 point above the long-term average (post-1980). It is somewhat concerning that prior bull markets have mostly ended at valuations similar to current levels (excluding the 1990s, when the PE approached 30). However, valuations can stay above average for long periods during the latter half of bull markets while stocks are lifted by earnings gains.
What’s next?
Earnings will be particularly critical for markets this week, the first busy week of earnings season with 100 S&P 500 companies slated to report results. Although earnings may present an opportunity for stocks to push higher, they are also a risk. Should earnings estimates get revised sharply lower during this earnings season (as they were last quarter) and push out the return of positive earnings growth, stocks may have a more difficult time adding to recent gains. We continue to expect strong earnings improvement beginning in the second quarter (the current quarter), and we continue to believe that the consensus expectations for mid-single-digit earnings gains in the second half of 2016 are achievable, should the drags from oil and the strong U.S. dollar abate. (For more on earnings, see our recent earnings preview.)
Bottom line
After such a strong rally off of the February lows, the key question for markets is: Where do stocks go from here? A look at historical stock market performance after sharp rallies does not sway us from our expectations for modest, mid-single-digit returns for stocks in 2016. We acknowledge that technical conditions for the market have improved, sentiment remains relatively contained (there is still a wall of worry to climb), and the potential exists for a strong earnings rebound in the second half of 2016. These factors, along with dimming prospects of recession, have left us a bit more constructive on stocks than we were at the start of the year.
But several risks prevent us from considering getting more aggressive here, particularly the potential for oil to give back recent gains (WTI crude oil futures opened 6% lower overnight after global oil producers failed to agree to a production freeze, but pared losses after trading resumed in other markets). Other market risks we continue to follow closely include a possible “Brexit” (the U.K. exiting the European Union), a potential hard landing in China, and U.S. election uncertainty.
IMPORTANT DISCLOSURES
The opinions voiced in this material are for general information only and are not intended to provide specific advice or recommendations for any individual. To determine which investment(s) may be appropriate for you, consult your financial advisor prior to investing. All performance referenced is historical and is no guarantee of future results.
The economic forecasts set forth in the presentation may not develop as predicted and there can be no guarantee that strategies promoted will be successful.
Investing in stock includes numerous specific risks including: the fluctuation of dividend, loss of principal, and potential liquidity of the investment in a falling market.
All investing involves risk including loss of principal.
INDEX DESCRIPTIONS
The Standard & Poor’s 500 Index is a capitalization-weighted index of 500 stocks designed to measure performance of the broad domestic economy through changes in the aggregate market value of 500 stocks representing all major industries.
Copyright © LPL Financial