
Crude Oil and Gold Directions
For this week's Equity Leaders Weekly, we will update some key Commodities in Crude Oil and Gold. Since last looking at the pair back in February we've seen much volatility with crude running over 12% from Feb 25 until now, and Gold breaking through strong resistance. These overall movements and new support and resistance levels are outlined in the charts provided.
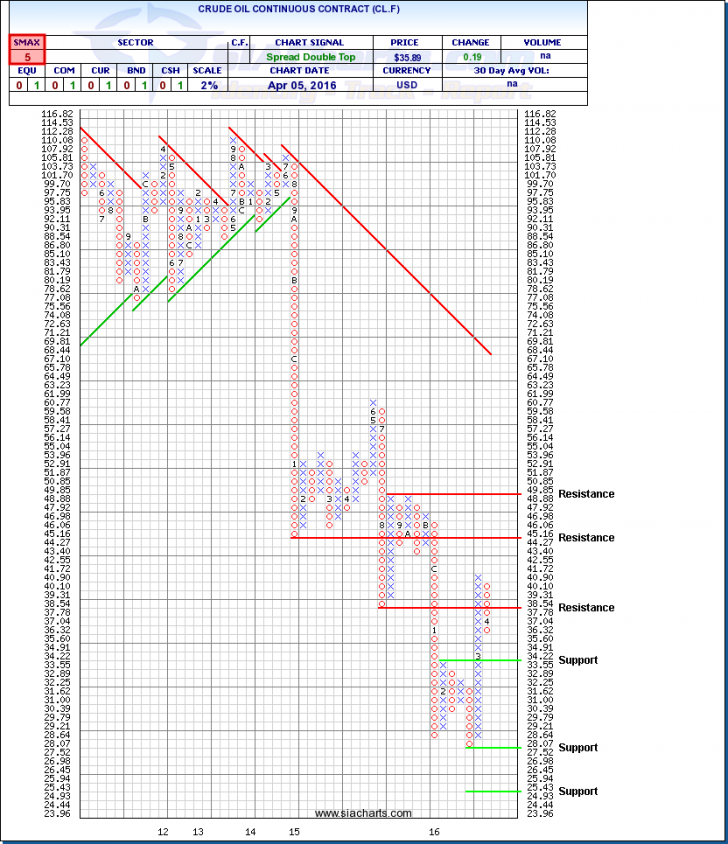
Crude Oil Continuous Contract (CL.F)
Crude Oil has certainly been the talk of the markets with rumors of short squeezes being the motivation of its strong bounce off of lows in February. This certainly is a factor in the movement up but the main culprit is policy coming out the Fed, which kept rates down in an effort to mitigate some of the economies that depend heavily on Crude dipping into a deep recession. Main resistance for Crude sits at $45.16 with more at $49.85. A close above this second resistance would be needed to break out of the current shorter term downtrend with significant work from there to reach its longer term downtrend line. To the downside a close below $33.55 opens the door for a stronger retracement back to the $30 or lower range. Crude remains very volatile and surprisingly, unlike Gold its recent strength, has not carried its dependent equities sector into the top of the SIA sector reports. As such it appears significantly more work is needed by Crude to boost the prospects of the Energy sector at large.
Click on Image to Enlarge
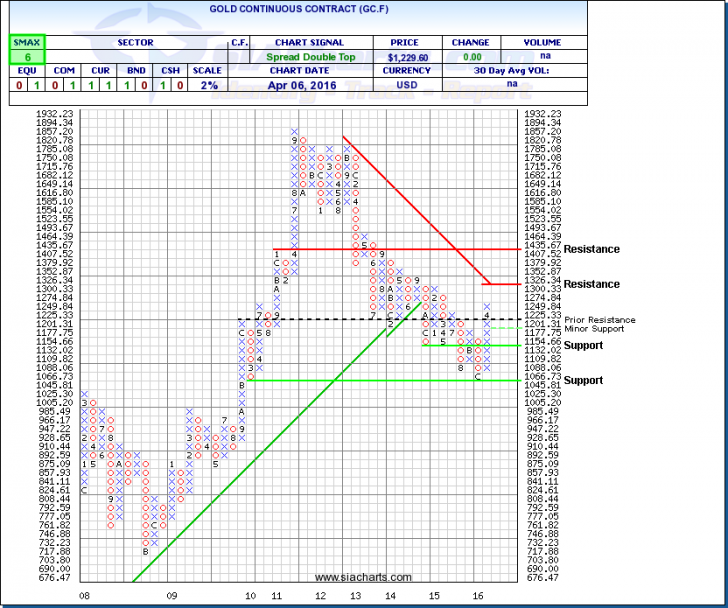
Gold Continuous Contract (GC.F)
Gold has moved up a bit more and has broken through one resistance level since our last update in early February and now stands within a few percentage points of key resistance, its downtrend line. A close above $1,326 would signal a breach of this important resistance point with room to the mid $1,400 range from there. To the downside support is above $1,177.75 with a close below signaling an opportunity for the bottom of the range to be tested. Gold has benefitted as of late by a weaker USD and as such continued weakness in the Dollar should be needed for the tests above to be breached.
From here it will be interesting to see if the Fed continues to seek a lower dollar in an effort to stave off downturns in economies dependent on Crude and other commodities revenue. This effort is designed to keep these economies rolling enough to mitigate a strong decline in sales from the U.S. to these countries. What is impressive from a U.S. Equity or U.S. Bond investors stand point is the decline in the USD has not reduced the relative strength of these U.S. asset classes. This would suggest at least for now the current downtrend in the USD has not caused money flows to start exiting the U.S. and seek other economies assets, such as Canada.
For a more in-depth analysis on the relative strength of the equity markets, bonds, commodities, currencies, etc. or for more information on SIACharts.com, you can contact our customer support at 1-877-668-1332 orsiateam@siacharts.com.
Click on Image to Enlarge
SIACharts.com specifically represents that it does not give investment advice or advocate the purchase or sale of any security or investment. None of the information contained in this website or document constitutes an offer to sell or the solicitation of an offer to buy any security or other investment or an offer to provide investment services of any kind. Neither SIACharts.com (FundCharts Inc.) nor its third party content providers shall be liable for any errors, inaccuracies or delays in content, or for any actions taken in reliance thereon.