by Don Vialoux, Timingthemarket.ca
Pre-opening Comments for Tuesday March 15th
U.S. equity index futures were lower this morning. S&P 500 futures were down 13 points in pre-opening trade.
Index futures added to declines following release of economic news at 8:30 AM EDT. Consensus for February Retail Sales was a drop of 0.1% versus a downwardly revised 0.4% drop in January. Actual was a drop of 0.1%. Excluding auto sales, consensus for February Retail Sales was a slip of 0.2% versus a downwardly revised 0.4% drop in January. Actual was a drop of 0.1%. Consensus for February Producer Prices was a drop of 0.2% versus a gain of 0.1% in January. Actual was a drop of 0.2%. Excluding food and energy, consensus for February Producer Prices was an increase of 0.1% versus a gain of 0.4% in January. Actual was unchanged. Consensus for March Empire Manufacturing Index was -9.5% versus -16.6 in February. Actual was +0.6.
Valeant plunged $12.29 to $56.75 after reporting lower than consensus fourth quarter revenues and earnings and after lowering first quarter guidance.
Whirlpool (WHR $166.04) is expected to open higher after JP Morgan upgraded the stock to Overweight from Neutral.
Tiffany slipped $1.26 to $70.60 after Citigroup downgraded the stock to Neutral from Buy.
EquityClock’s Daily Market Comment
Following is a link:
http://www.equityclock.com/2016/03/14/stock-market-outlook-for-march-15-2016/
Note study showing performance of the S&P 500 Index the week before and after Triple Witching in March (March 18th this year). The Index has a history of coming under short term pressure in the week following March Triple Witching.
StockTwits Released Yesterday @EquityClock
Pivotal week ahead for equity and bond markets!
Technical action by S&P 500 stocks to 10:15 AM: Quietly bullish. Breakouts: $WHR, $ROP, $GGP. No breakdowns.
Editor’s Note: After 10:15 AM, another 6 S&P 500 stocks broke intermediate resistance (LOW, TRIP, CME, PSA, ATVI, AZO) and none broke support.
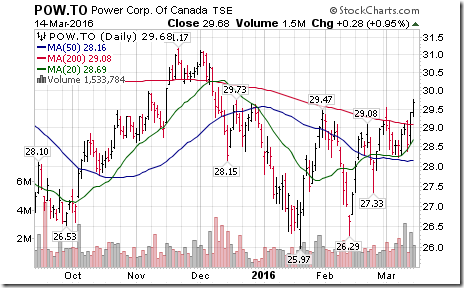
Nice breakout by Power Corp $POW.CA above resistance at $29.47 to resume an intermediate uptrend.
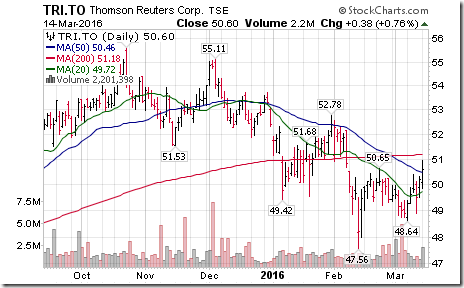
Nice breakout by Thomson Reuters $TRI.CA above $50.65 to complete a base building pattern.
Trader’s Corner
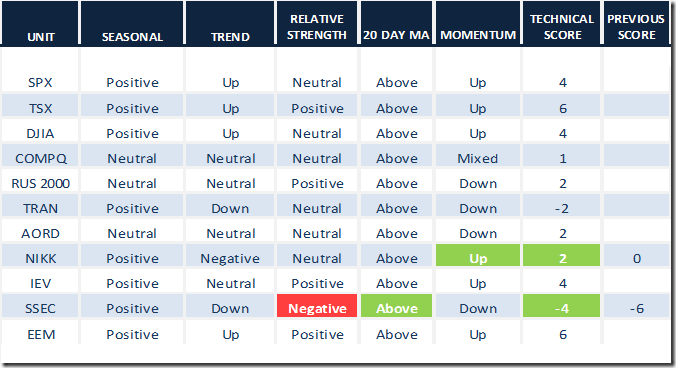
Daily Seasonal/Technical Equity Trends for March 14th 2016
Green: Increase from previous day
Red: Decrease from previous day
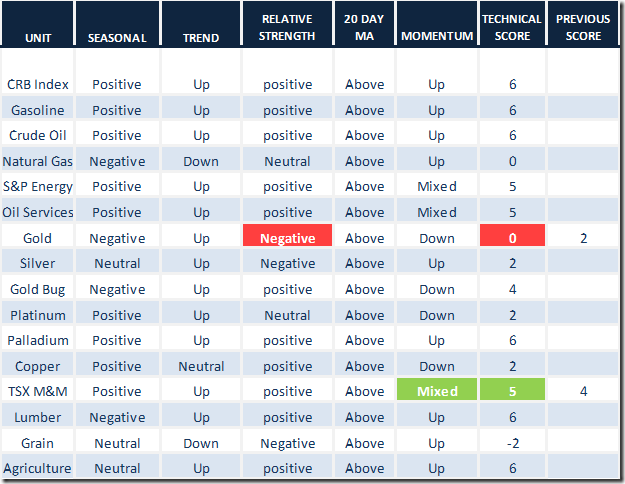
Daily Seasonal/Technical Commodities Trends for March 14th 2016
Green: Increase from previous day
Red: Decrease from previous day
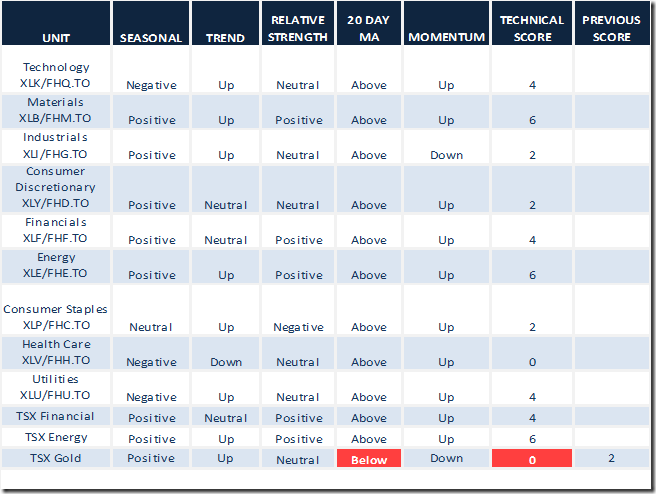
Daily Seasonal/Technical Sector Trends for March 14th 2016
Green: Increase from previous day
Red: Decrease from previous day
CastleMoore Comments
INVESTMENT COMMENTARY
Tuesday, March 15, 2016
If you like to receive our bi-monthly newsletter or know more about our model portfolios and investment philosophy and what areas we are invested in now for clients please complete the form at: http://www.castlemoore.com/investorcentre/signup.php.
Please see join Hap Sneddon on BNN’s Market Call Tonight this WEDNESDAY, MARCH 16, 6-7PM
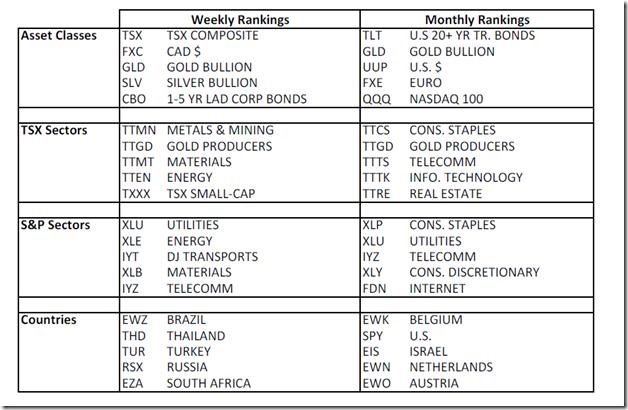
TOP ASSET 5 CLASSES, SECTORS AND COUNTRY HEAT MAPPING
Commentary:
Asset Classes
On the monthly rankings (longer term) we see US bonds still in the top 5 and number 1 for February with commodities and the TSX at the bottom (not show) yet confirming the pro-cyclical move in the last couple of weeks is a longer term buy
CDN Equity Sectors
Short term all the resources have bounced from lows in early January and are currently running into resistance. Longer term defensive sectors still dominate.
US Equity Sectors
Both the weekly and monthly ranking table look very similar to Canada’s with materials and energy rising short term, but bottom 2 longer term, and defensives along with consumer discretionary strong on an investing timeframe (vs. trading)
Country Indices
Likewise with the country rankings we see resource-based indices strong on the short-term and more prosaic and reliable markets strong on the longer term.
CHARTS of the WEEK
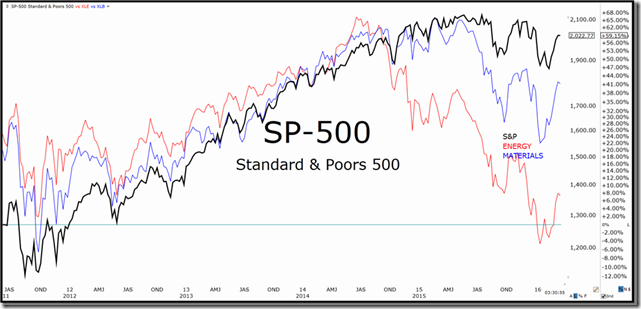
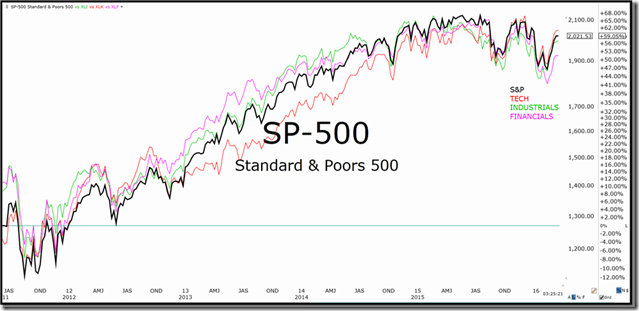
2016 Q1 Earnings are expected to be volatile with consensus (Sept 2015) numbers being taken down from +5% YoY EPS to -7.4% (Factset). Guidance for Q1 sees 88 companies issuing negative EPS guidance and 22 companies positive EPS guidance.
The Bottom
Energy and Materials are going to be down substantially. The question investors are looking to have answered is whether this is the kitchen sink quarter
The Modestly Lowered
Technology, Industrial and Financial forward earnings will only be modestly but also notably lower.
There will be a disparity top to bottom which will present individual stock opportunities over ETF ones.
Holding Their Own
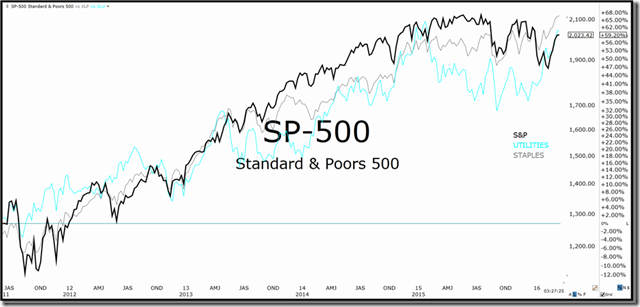
Utilities and staples have been predictable and stable, yet offer limited upside surprises. These will hold in well so long as bond yields don’t rise dramatically. Some constituents and ETFs are making new highs.
The Best
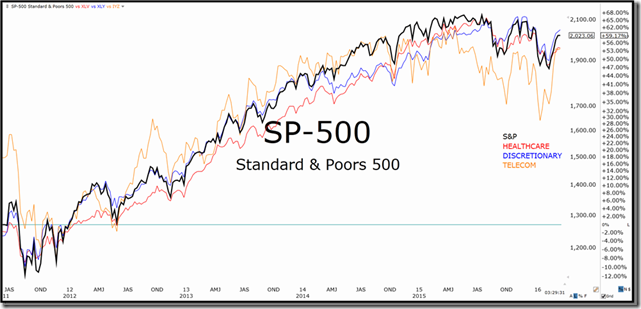
Healthcare, Consumer discretionary and Telecom show improvement in forward EPS guidance. Healthcare has been significantly impacted by biotech. Biotech is in a long term uptrend but exceptionally volatile. Many components of discretionary and the entire telecom sectors have staple-like qualities.
CastleMoore Inc.
Buy, Hold…and Know When to Sell
This commentary is not to be considered as offering investment advice on any particular security or market. Please consult a professional or if you invest on your own do your homework and get a good plan, before risking any of your hard earned money. The information provided in CastleMoore Investment Commentary or News, a publication for clients and friends of CastleMoore Inc., is intended to provide a broad look at investing wisdom, and in particular, investment methodologies or techniques. We avoid recommending specific securities due to the inherent risk any one security poses to ones’ overall investment success. Our advice to our clients is based on their risk tolerance, investment objectives, previous market experience, net worth and current income. Please contact CastleMoore Inc. if you require further clarification on this disclaimer.
Special Free Services available through www.equityclock.com
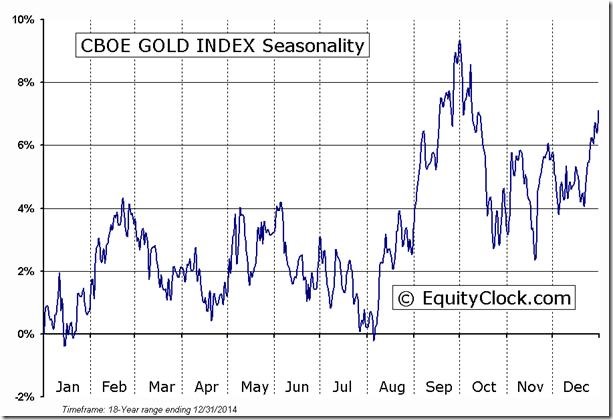
Equityclock.com is offering free access to a data base showing seasonal studies on individual stocks and sectors. The data base holds seasonality studies on over 1000 big and moderate cap securities and indices. To login, simply go to http://www.equityclock.com/charts/ Following is an example:
Interesting Chart
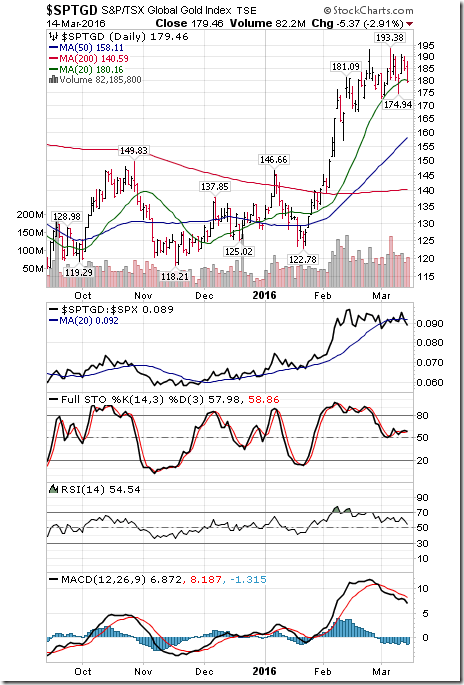
Gold and gold stocks on both sides of the border continue to show technical signs of deterioration. For example, the TSX Gold Index effectively peaked four weeks ago and has been drifting lower when equity indices have been moving higher. Short term momentum indicators are trending down. Yesterday, the Index slipped below its 20 day moving average.
Disclaimer: Seasonality and technical ratings offered in this report by www.timingthemarket.ca and www.equityclock.com are for information only. They should not be considered as advice to purchase or to sell mentioned securities. Data offered in this report is believed to be accurate, but is not guaranteed
Copyright © DV Tech Talk, Timingthemarket.ca


