


SIA Weekly: A Look at Gold and Gold Miners
For this week’s edition of the Equity Leaders Weekly, we are going to take a look at the gold markets and the recent performance of some of the Gold Equities via the Van Eck Gold Miners ETF (GDX). We are also going to take a look at the comparison chart of the Gold Bullion (GC.F) vs. Gold equities via the Van Eck Gold Miners ETF (GDX) to see which has outperformed, Gold Bullion or Gold Equities. Gold can be considered a “safe haven” play in times is increased uncertainty and economic weakness. What we are seeing now is no different. With certain countries going through economic slowdowns such as Canada, Europe and even China, with their announcement to cut its reserve requirement ratio for a fifth time in a year, the markets are concerned with overall global growth weakness. The U.S. has held up considerably well during this time frame and have come out with fairly strong economic numbers of late. For example, a recent report from the US said that construction spending rose 1.5% in January which marks the highest level in each 8 years. Data also showed that U.S. manufacturing also stabilized in February. We are not in the business of predicting future interest rate moves but It will be interesting to see what direction the U.S. Federal Reserve takes on its interest rate policy as interest rate hikes may lead to a stronger U.S. dollar which may suppress the price of Gold Bullion. It may also suggest that the U.S. economy is well on track to sustained healthy growth.
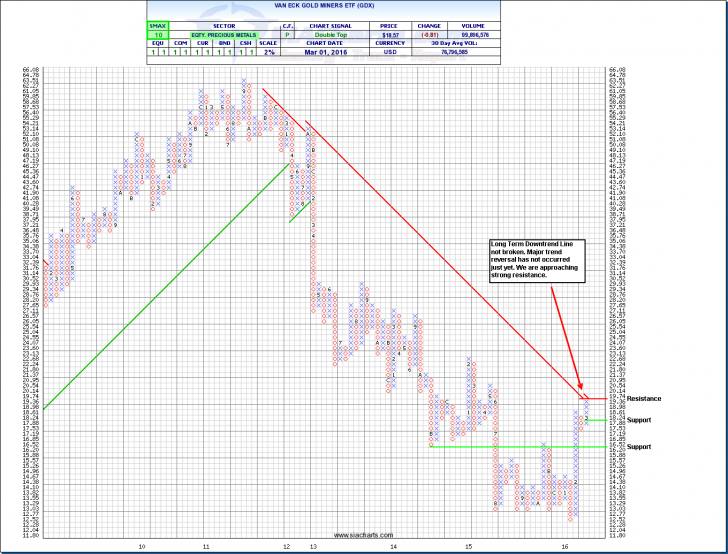
Van Eck Gold Miners ETF (GDX)
Let’s examine the recent strength we have seen in Gold Equities of late using the Van Eck Gold Miners ETF (GDX) as most of you have seen a recent move of gold equities reaching the favored portion of some of our SIA’s reports. A short term rally has certainly materialized in the gold equities. In looking at the chart of GDX, we see that GDX has had a steady uptrend in February. But in looking at the chart closely, we see that the long term downtrend line in on the verge but has not quite broken as yet. Gold can be considered a safe haven play in times of uncertainty and economic weakness. Will this uncertainty and economic weakness continue?; only time will tell. Support for GDX is at $17.88, and, below that, $16.20. To the upside, there is strong resistance at $19.74. We need to see a bit more move upwards past the downward trend line to see if this short term rally can materialize into a major trend reversal.
Click on Image to Enlarge
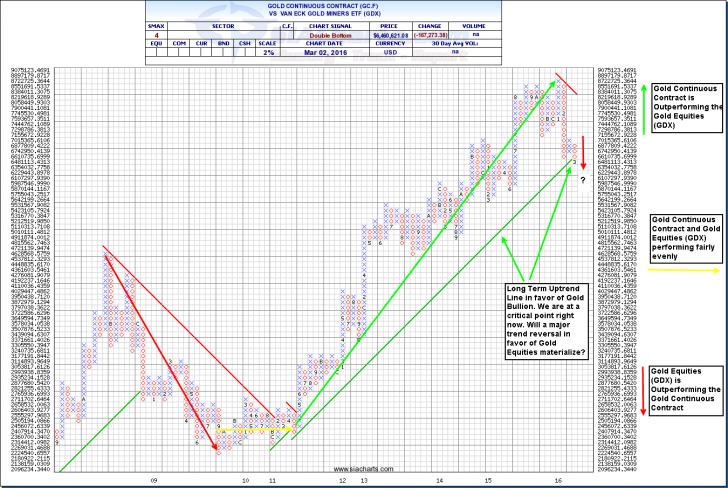
Gold Continuous Contract (GC.F) vs. Van Eck Gold Miners ETF (GDX)
After looking at the chart of the Van Eck Gold Miners ETF (GDX) and the strength that has occurred in the GDX, let’s draw our attention to the comparison chart of the Gold Continuous Contract and the GDX. In the attached chart, a rising column of X’s indicates the Gold Continuous Contract (GC.F) had won the relative battle over Gold Equities via the Van Eck Gold Miners ETF (GDX). A descending column of O’s indicates the GDX had won the relative battle over the Gold Continuous Contract. From November of 2008 to the Fall of 2009, we had seen the Gold Continuous Contract had won the relative battle over the GDX. Then after a brief sideways movement from the fall of 2009 to the Spring of 2011 when neither Gold Bullion and Gold equities outperformed. Then in May of 2011 to the beginning of this year, we can see that the Gold Bullion had won the relative battle over Gold Equities (GDX). But recently starting in February, we see a change in leadership in which the Gold Equities have started to outperform the Bullion up until today.
We could be at a critical inflection point as to whether a major trend reversal will materialize as it is testing a break of the long term uptrend which has favored Gold bullion for the past 5 years. It will be interesting to see if a trend reversal in favor of the Gold Equities over Bullion will materialize in the coming days/weeks/months. It is also very important to note, the comparison chart does not mean that Gold Bullion has exhibited overall market strength from 2010 to late last year. This was simply not the case; it is merely reflecting that Gold bullion had better relative strength vs. Gold Equities. Also note, as we see a potential change in trend in which the Gold equites may outperform Gold Bullion, it is only a relative strength battle comparison against each other. It does not mean Gold Equites will exhibit overall market strength and to see this analysis, please look at the SIA Asset Class rankings and the SIA Sector rankings to help better understand their relative strength relationship.
Click on Image to Enlarge
SIACharts.com specifically represents that it does not give investment advice or advocate the purchase or sale of any security or investment. None of the information contained in this website or document constitutes an offer to sell or the solicitation of an offer to buy any security or other investment or an offer to provide investment services of any kind. Neither SIACharts.com (FundCharts Inc.) nor its third party content providers shall be liable for any errors, inaccuracies or delays in content, or for any actions taken in reliance thereon.
For a more in-depth analysis on the relative strength of the equity markets, bonds, commodities, currencies, etc. or for more information on SIACharts.com, you can contact our customer support at 1-877-668-1332 or at siateam@siacharts.com.
Copyright © SIACharts.com