by Don Vialoux, Timingthemarket.ca
StockTwits Released Yesterday @equityclock
For the month of March the S&P 500 has gained 65% of the time, averaging a return of 1.1%
Technical action by S&P 500 stocks to 10:00: Quietly bullish. Breakouts: $DRI, $YUM, $VTR, $JEC. No breakdowns.
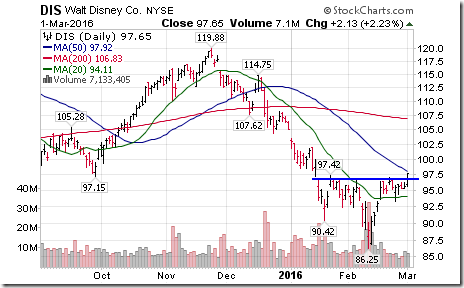
Editor’s Note: After 10:00 AM EST, another 18 S&P 500 stocks broke intermediate resistance and two stocks broke support. Lots of classic basing patterns by stocks breaking resistance (e.g. Disney with a reverse head and shoulders pattern)!
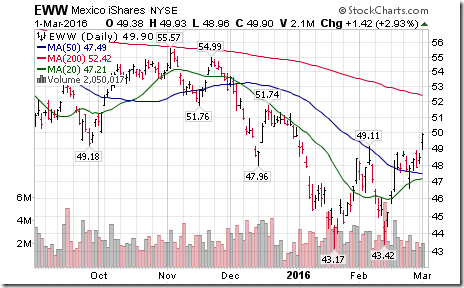
Nice breakout by Mexico iShares $EWW above resistance at $49.11 to complete a double bottom!
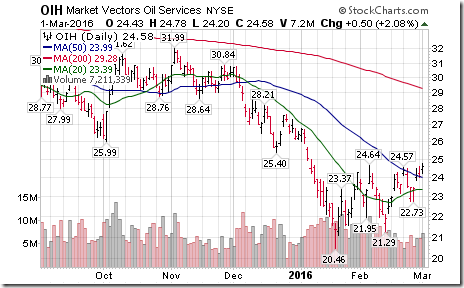
Nice breakout by Market Vector Oil Services ETF $OIH above resistance at $24.64 to complete a base building pattern!
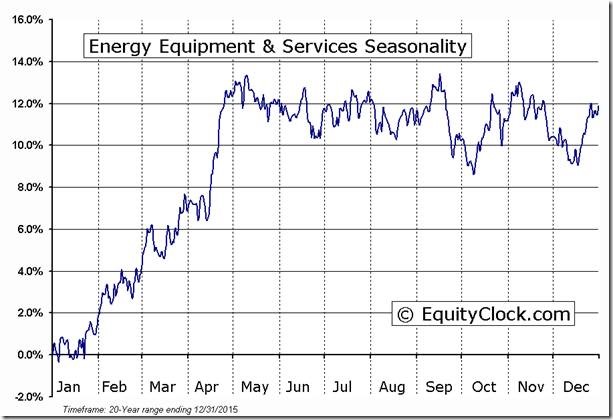
‘Tis the season for strength in the Oil Services sector into mid-May!
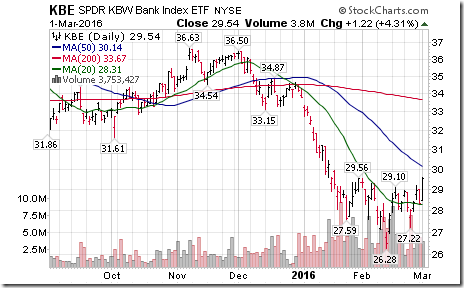
Nice breakout by KBE Bank ETF $KBE above $29.56 to complete a reverse head and shoulders pattern!
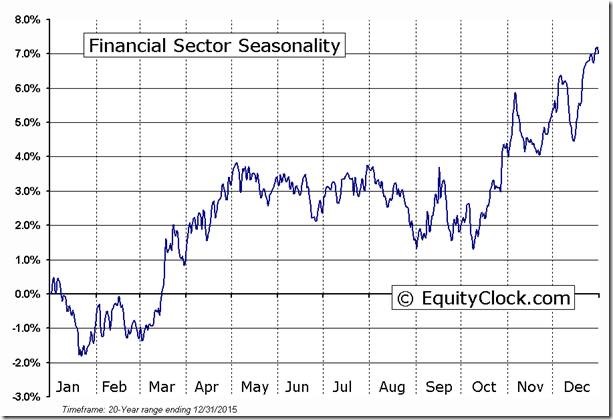
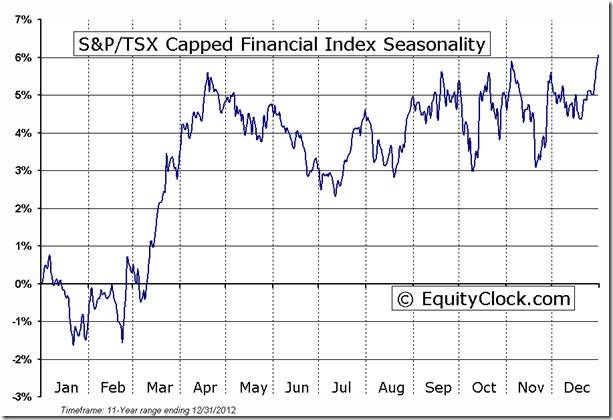
‘Tis the season for U.S. Financials to move higher to the end of May!
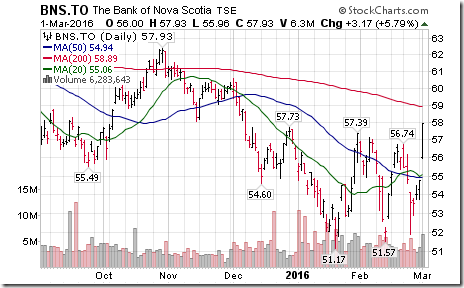
Nice breakout by Scotia Bank $BNS.CA above resistance at $57.39 to complete a double bottom pattern!
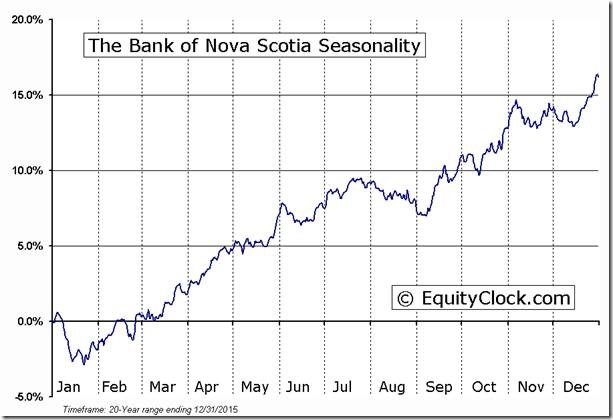
‘Tis the season for Bank of Nova Scotia to move higher to late May!
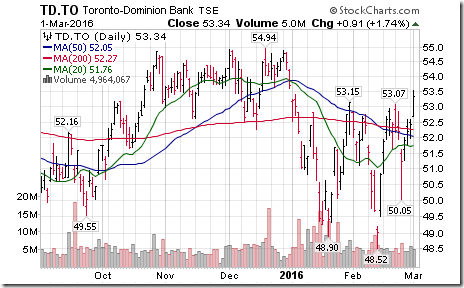
Nice breakout by TD Bank $TD. CA above resistance at $53.15 to complete a double bottom pattern!
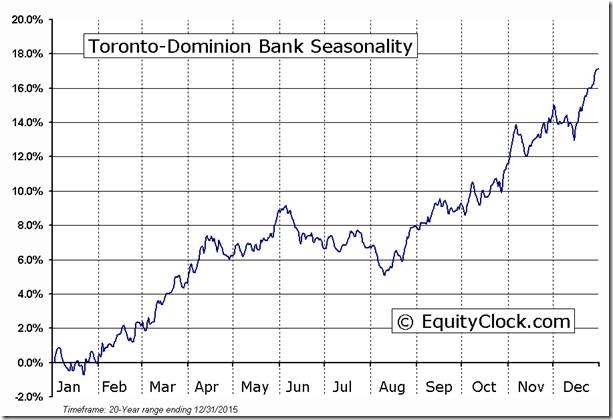
‘Tis the season for Toronto Dominion Bank $TD.CA to move higher to late May.
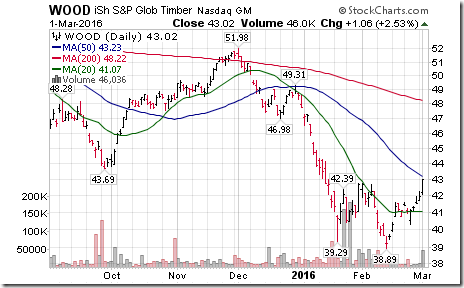
Nice breakout by the lumber equity ETF $WOOD above $42.79 to complete a double bottom pattern!
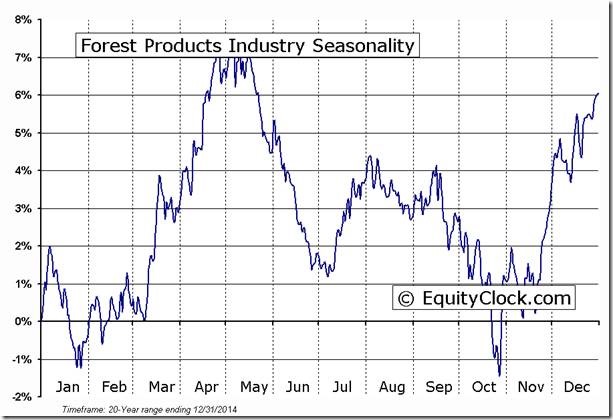
‘Tis the season for strength in lumber equities into early May!
Trader’s Corner
Due to unforeseen circumstances, Trader’s Corner is not available for today. We hope to have it up and running for Thursday edition. Thank you.
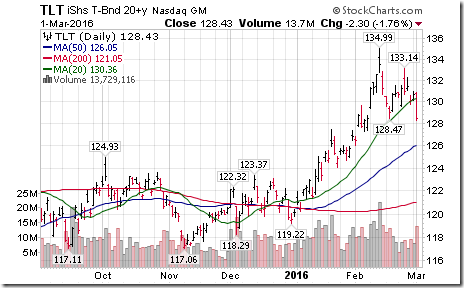
Interesting Chart
OOOPs!
Special Free Services available through www.equityclock.com
Equityclock.com is offering free access to a data base showing seasonal studies on individual stocks and sectors. The data base holds seasonality studies on over 1000 big and moderate cap securities and indices. To login, simply go to http://www.equityclock.com/charts/ Following is an example:
Disclaimer: Seasonality and technical ratings offered in this report by www.timingthemarket.ca and www.equityclock.com are for information only. They should not be considered as advice to purchase or to sell mentioned securities. Data offered in this report is believed to be accurate, but is not guaranteed
Copyright © DV Tech Talk, Timingthemarket.ca


