by Don Vialoux, Timingthemarket.ca
Economic News This Week
February Chicago PMI report to be released at 9:45 AM EST on Monday is expected to slip to 52.0 from 55.6 in January
Canadian December Real GDP to be released at 8:30 AM EST on Tuesday is expected to increase 0.1% versus a gain of 0.3% in November. Fourth quarter GDP is expected to increase 0.1% versus a gain of 2.3% in the third quarter.
January Construction Spending to be released at 10:00 AM EST on Tuesday is expected to increase 0.5% versus a gain of 0.1% in December.
February ISM Index to be released at 10:00 AM EST on Tuesday is expected to improve to 49.0 from 48.2 in January.
February ADP Private Employment Report to be released at 8:15 AM EST on Wednesday is expected to drop to 190,000 from 205,000 in January.
Fed Beige Book is to be released at 2:00 PM EST on Wednesday
Weekly Initial Jobless Claims to be released at 8:30 AM EST on Thursday is expected to slip to 270,000 from 272,000 last week.
Fourth Quarter Productivity to be released at 8:30 AM EST on Thursday is expected to drop 3.3% versus a previous estimate of a 3.0% drop.
January Factory Orders to be released at 10:00 AM EST on Thursday are expected to increase 2.0% versus a drop of 2.9% in January.
February ISM Services Index to be released at 10:00 AM EST on Thursday is expected to slip to 53.1 from 53.1 in January.
February Unemployment Rate to be released at 8:30 AM EST on Friday is expected to remain unchanged at 4.9%. February Hourly Earnings are expected to increase 0.2% versus a gain of 0.5% in January. February Non-farm Payrolls are expected to increase to 190,000 from 151,000 in January. February Private Non-farm Payrolls are expected to increase to 180,000 from 158,000 in January.
January Trade Deficit to be released at 8:30 AM EST on Friday is expected to increase to $44.0 billion from $43.4 billion in December.
Canadian January Merchandise Trade Balance to be released at 8:30 AM EST on Friday is expected to be a deficit of $790 million versus a deficit of $585 million in December.
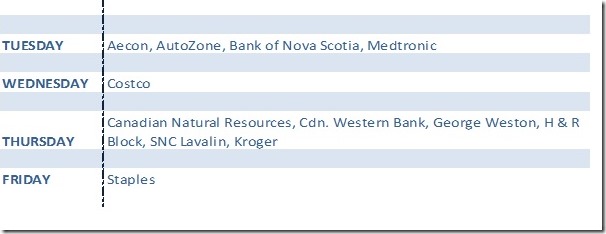
Earnings News This Week
The Bottom Line
The current intermediate uptrend is short term overbought. Since lows set on January 21st, the Dow Jones Industrial Average has gained 7.7% and the TSX Composite Index has advanced 11.0%. Prudent strategy is to accumulate ETFs and equities on weakness. Economically sensitive sectors with positive seasonal influences are preferred (e.g. Materials, Industrials, Consumer Discretionary and Energy in the U.S. as well as Base Metals, Energy and Financials in Canada. Outside of North America, European and Emerging Market ETFs also are attractive
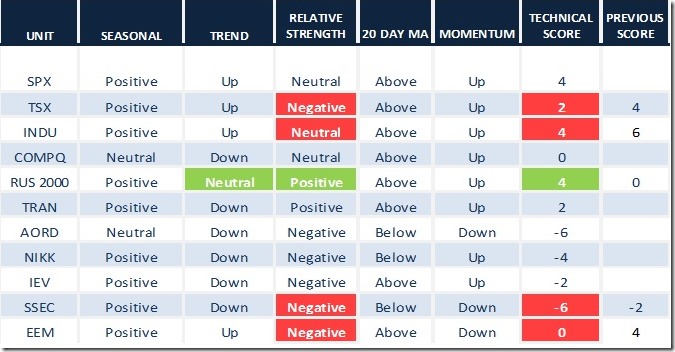
Daily Seasonal/Technical Equity Trends for February 26th 2016
Green: Increase from previous day
Red: Decrease from previous day
Calculating Technical Scores
Technical scores are calculated as follows:
Intermediate Uptrend based on at least 20 trading days: Score 2
Higher highs and higher lows
Intermediate Neutral trend: Score 0
Not up or down
Intermediate Downtrend: Score -2
Lower highs and lower lows
Outperformance relative to the S&P 500 Index: Score: 2
Neutral Performance relative to the S&P 500 Index: 0
Underperformance relative to the S&P 500 Index: Score –2
Above 20 day moving average: Score 1
At 20 day moving average: Score: 0
Below 20 day moving average: –1
Up trending momentum indicators (Daily Stochastics, RSI and MACD): 1
Mixed momentum indicators: 0
Down trending momentum indicators: –1
Technical scores range from -6 to +6. Technical buy signals based on the above guidelines start when a security advances to at least 0.0, but preferably 2.0 or higher. Technical sell/short signals start when a security descends to 0, but preferably -2.0 or lower.
Long positions require maintaining a technical score of -2.0 or higher. Conversely, a short position requires maintaining a technical score of +2.0 or lower.
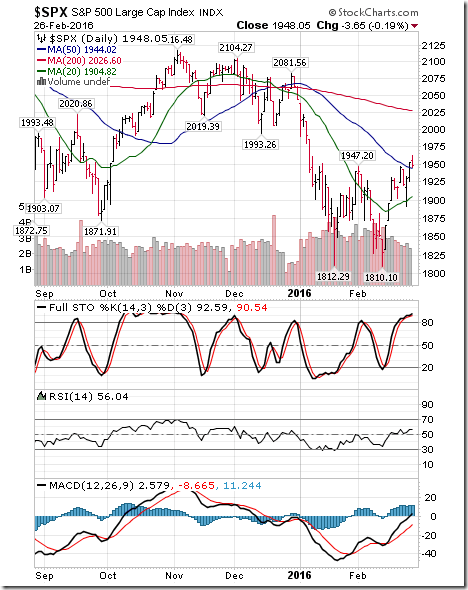
The S&P 500 Index gained 30.27 points (1.58%) last week. Intermediate trend changed to up from down on a move above 1947.20. The Index remains above its 20 day moving average. Short term momentum indicators are trending up, but are overbought.
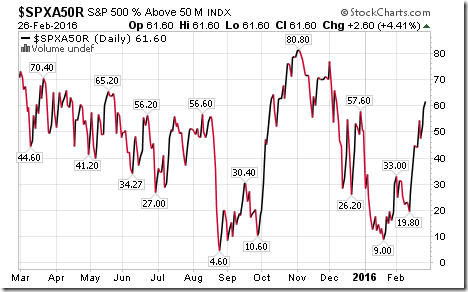
Percent of S&P 500 stocks trading above their 50 day moving average increased last week to 61.60% from 44.00%. Percent remains in an intermediate uptrend.
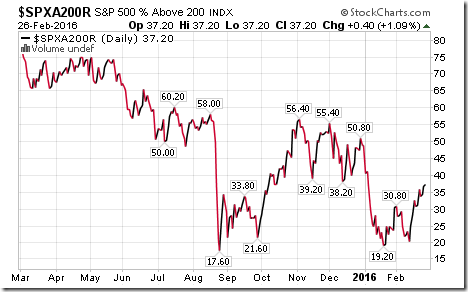
Percent of S&P 500 stocks trading above their 200 day moving average increased last week to 37.20% from 31.00%. Percent has established an intermediate uptrend.
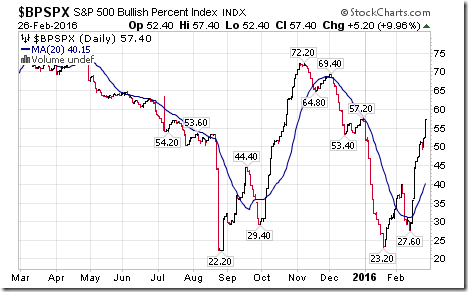
Bullish Percent Index for S&P 500 stocks increased last week to 57.40% from 47.20% and remained above its 20 day moving average. The Index remains in an intermediate uptrend.
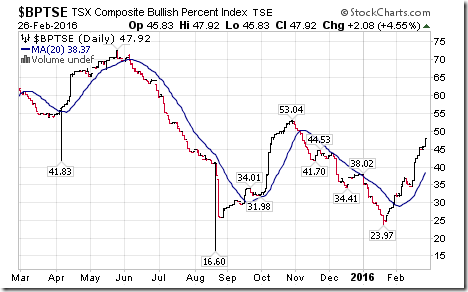
Bullish Percent Index for TSX stocks increased last week to 47.92% from 43.33% and remained above its 20 day moving average. The Index remains in an intermediate uptrend.
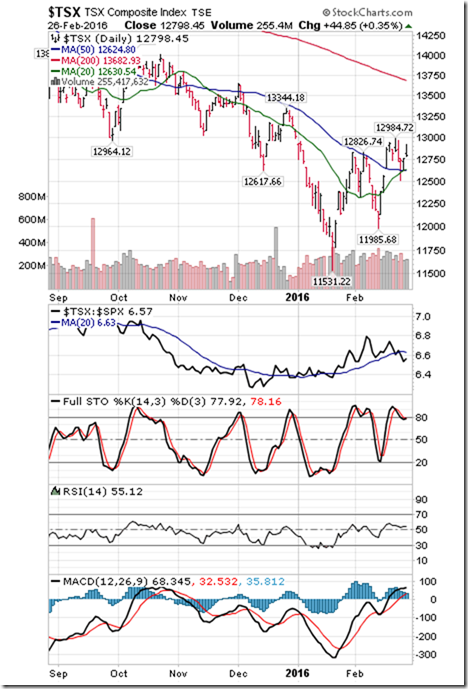
The TSX Composite Index dipped 14.97 points (0.12%) last week. Intermediate trend remained up (Score: 2). Strength relative to the S&P 500 Index changed to negative from positive (Score:-2). The Index remains above its 20 day moving average (Score: 1). Short term momentum indicators are trending up, but are overbought and showing early signs of peaking. Technical score dropped last week to 2 from 6
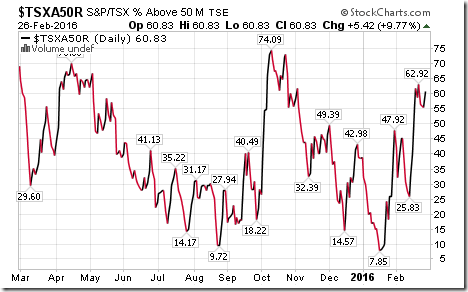
Percent of TSX stocks trading above their 50 day moving average increased last week to 60.83% from 58.58%. Percent remains in an intermediate uptrend.
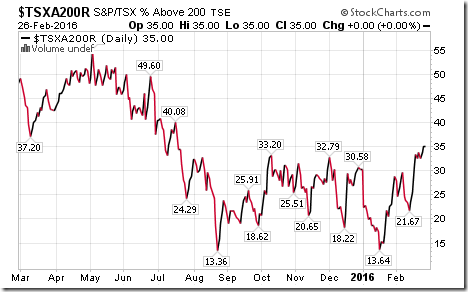
Percent of TSX stocks trading above their 200 day moving average increased last week to 35.00% from 32.64%. Percent remains in an intermediate uptrend.
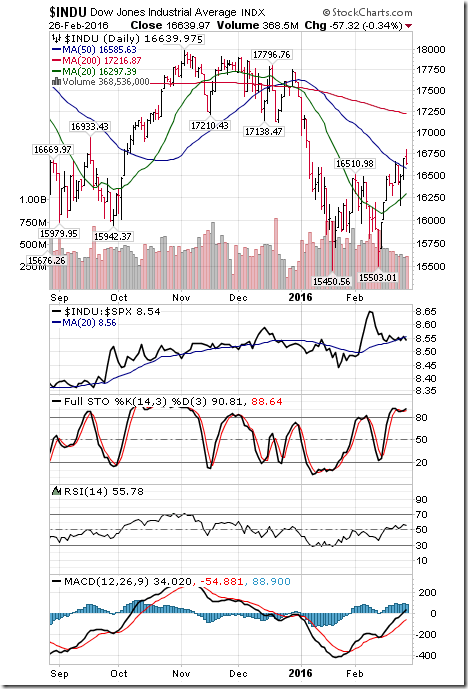
Dow Jones Industrial Average added 247.88 points (1.51%) last week. Intermediate trend remained up. Strength relative to the S&P 500 Index changed to neutral from positive. The Average remains above its 20 day moving average. Short term momentum indicators are trending up, but are overbought. Technical score dipped last week to 4 from 6.
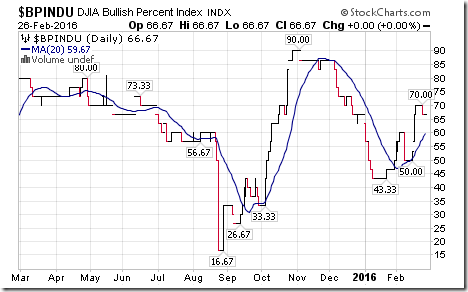
Bullish Percent Index for Dow Jones Industrial Average stocks slipped last week to 66.67% from 70.00% and remained above its 20 day moving average. The Index remains in an intermediate uptrend
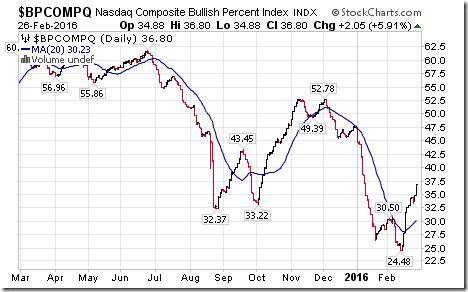
Bullish Percent Index for NASDAQ Composite stocks increase last week to 36.80% from 32.87% and remained above its 20 day moving average. The Index has established an intermediate uptrend.
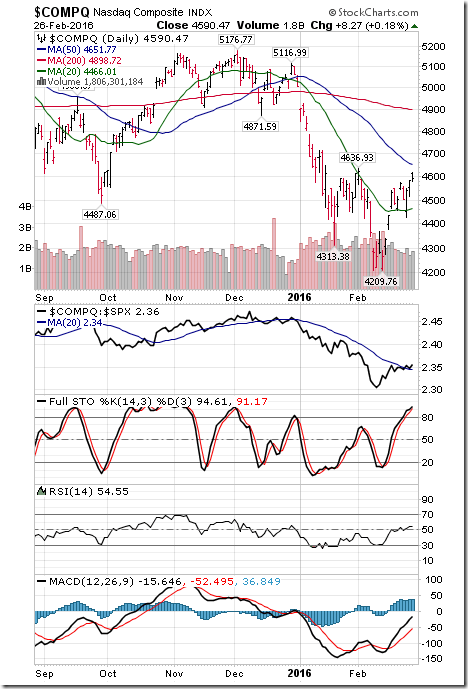
NASDAQ Composite Index gained 86.04 points (1.91%) last week. Intermediate trend remains down. The Index remained above its 20 day moving average. Strength relative to the S&P 500 Index improved last week to Neutral from Negative. Short term momentum indicators are trending up, but are overbought. Technical score improved last week to 0 from -2
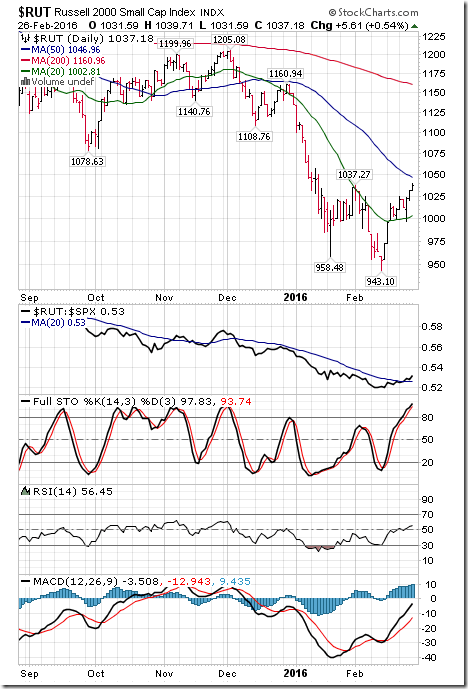
The Russell 2000 Index gained 27.17 points (2.69%) last week. Intermediate trend changed on Friday to Neutral from Down on a move above 1037.27. Strength relative to the S&P 500 Index turned Positive from Negative. The Index remained above its 20 day moving average. Short term momentum indicators are trending up, but are overbought. Technical score improved to 4 from -2
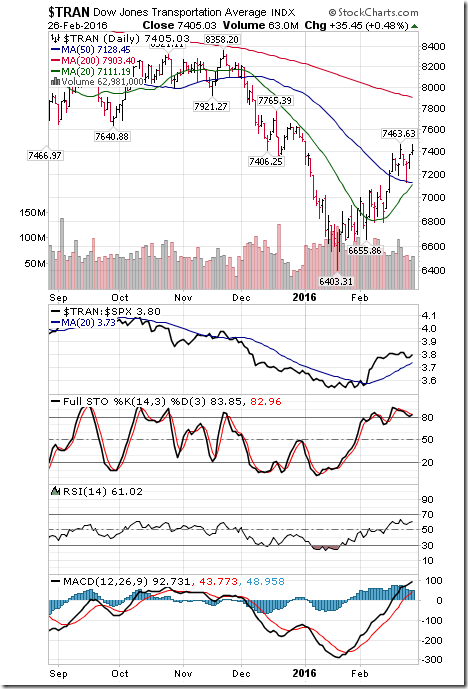
The Dow Jones Transportation Average added 119.08 points (1.63%) last week. Intermediate trend remains down. Strength relative to the S&P 500 Index remained positive. The Average remained above its 20 day moving average. Short term momentum indicators are trending up, but are overbought.
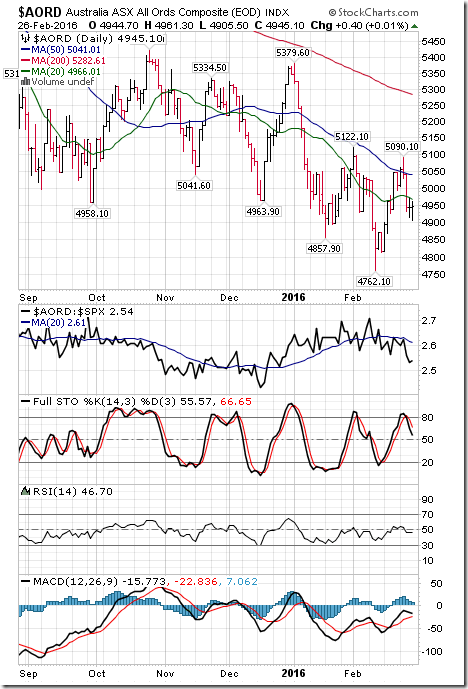
The Australia All Ordinaries Composite Index dropped 63.20 points (1.26%) last week. Intermediate trend remained down. Strength relative to the S&P 500 Index changed to Negative from Neutral. The Index dropped below its 20 day moving average. Short term momentum indicators are trending down. Technical score dropped last week to -6 from 0.
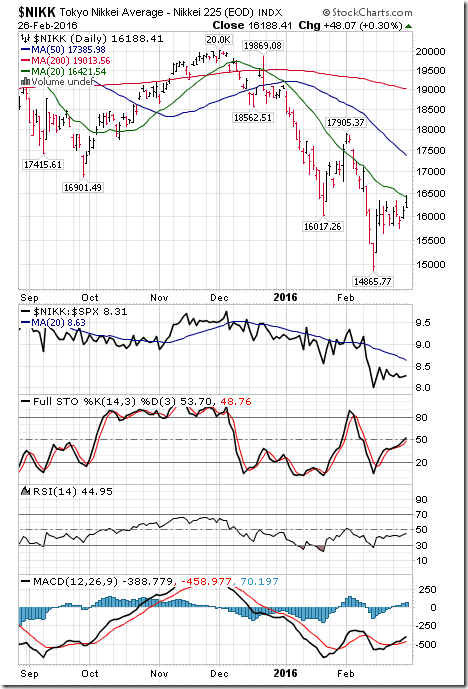
The Nikkei Average added 221.24 points (1.39%) last week. Intermediate trend remained down. Strength relative to the S&P 500 Index remained Negative. The Average remained below its 20 day moving average. Short term momentum indicators are trending up. Technical score remained last week at -4.
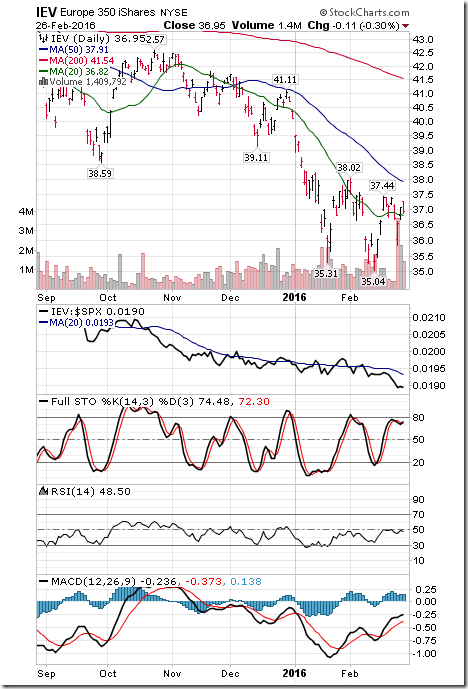
iShares Europe slipped $0.14 (0.38%) last week. Intermediate trend remained down. Strength relative to the S&P 500 Index turned Negative from Neutral. Units remain above their 20 day moving average. Short term momentum indicators are trending up , but are overbought. Technical score slipped last week to -2 from 0.
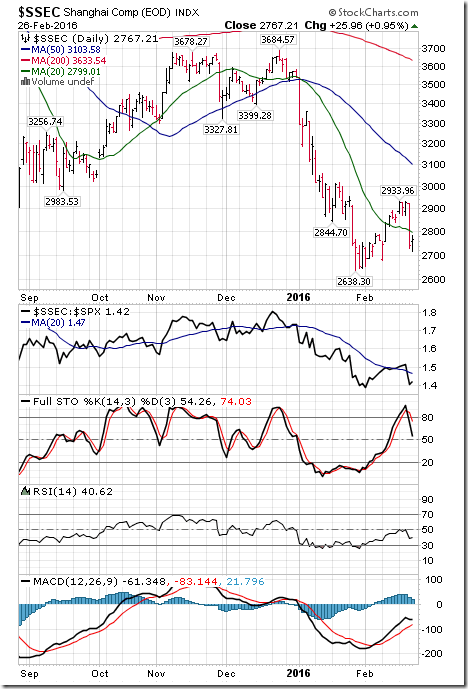
The Shanghai Composite Index dropped 92.81 points (3.25%) last week. Intermediate trend remained down. Strength relative to the S&P 500 Index changed to Negative from Neutral. The Index dropped below its 20 day moving average. Short term momentum indicators are trending down. Technical score dropped last week to -6 from 0.
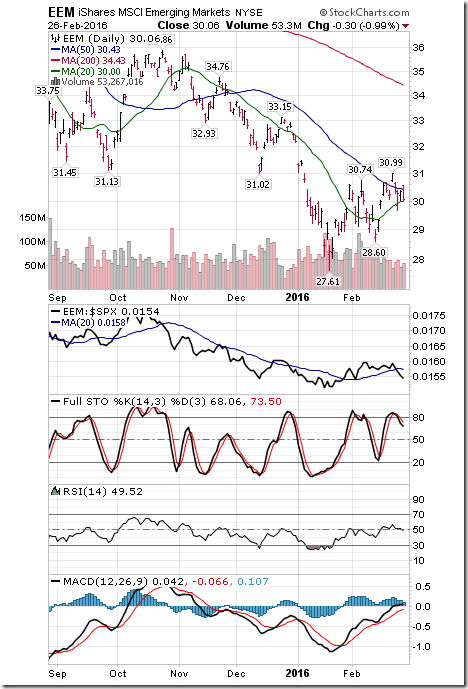
Emerging Markets dropped $0.18 (0.60%) last week. Intermediate trend changed to up from down on a move above $30.74. Strength relative to the S&P 500 Index changed to Negative from Positive. Units remain above their 20 day moving average. Short term momentum indicators have rolled over and are trending down. Technical score slipped last week to 0 from 2.
Currencies
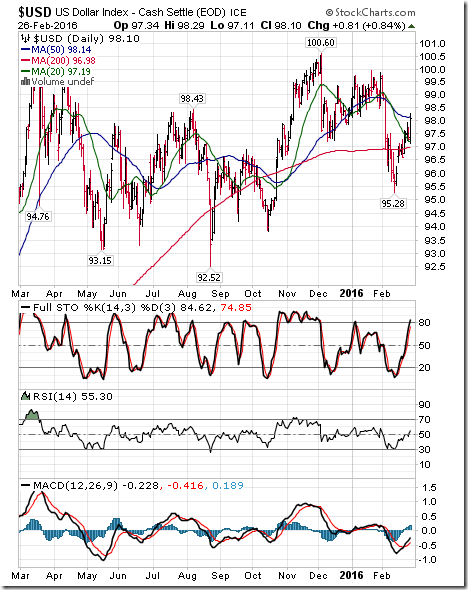
The U.S. Dollar Index gained 1.45 (1.50%) last week. Intermediate trend remains down. The Index moved above its 20 day moving average. Short term momentum indicators are trending up.
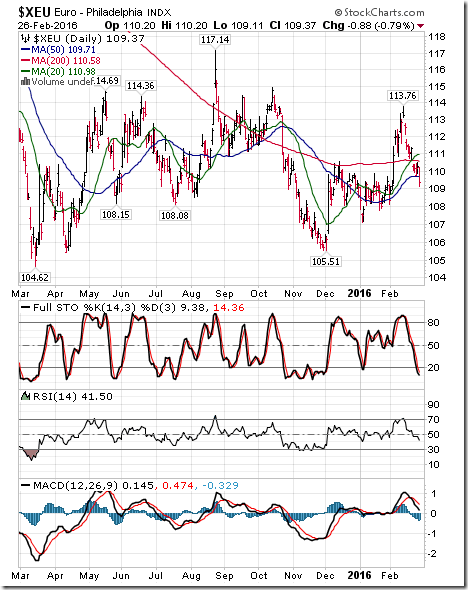
The Euro dropped 1.94 (1.74%) last week. Intermediate trend remains up. The Euro dropped below its 20 day moving average. Short term momentum indicators are trending down.
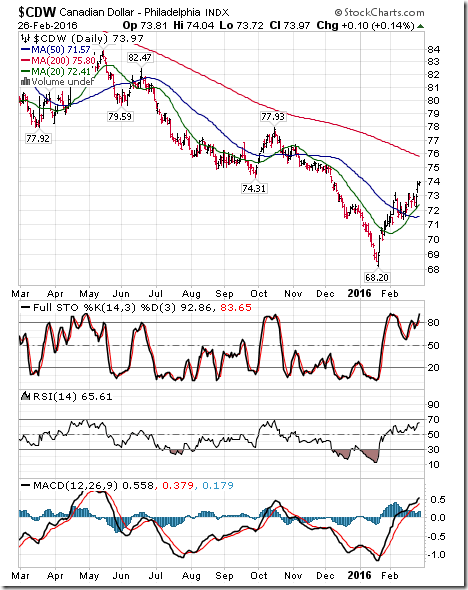
The Canadian Dollar added U.S. 1.37 cents (1.89%) last week. Intermediate trend changed to up from down on a move above 73.27 cents. The Canuck Buck remains above its 20 day moving average. Short term momentum indicators are trending up.
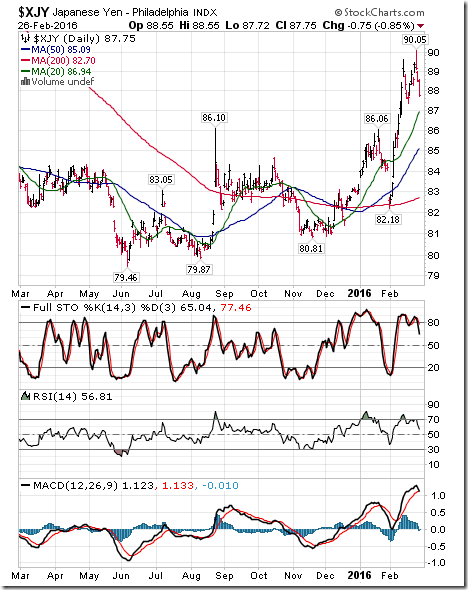
The Japanese Yen lost 1.02 (1.15%) last week. Intermediate trend remains up. The Yen remains above its 20 day moving average. Short term momentum indicators have just rolled over.
Commodities
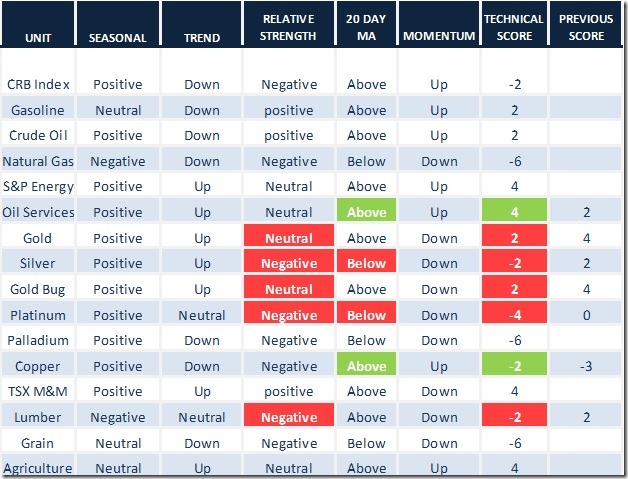
Daily Seasonal/Technical Commodities Trends for February 26th 2016
Green: Increase from previous day
Red: Decrease from previous day
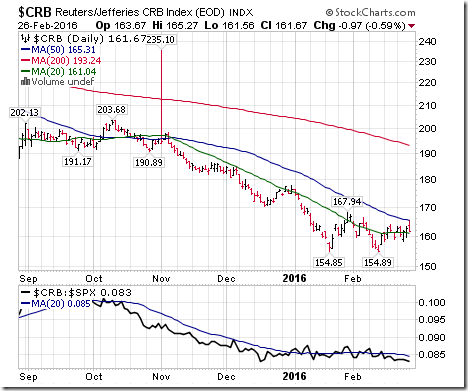
The CRB Index added 2.04 points (1.28%) last week. Intermediate trend remains down. Strength relative to the S&P 500 Index remains Negative. The Index moved above its 20 day moving average. Short term momentum indicators are trending up. Technical score improved last week to -2 from -4.
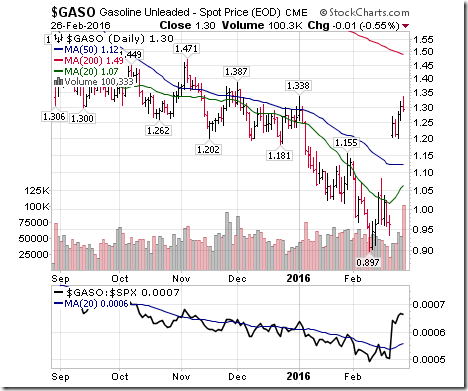
Gasoline gained $0.34 (35.42%) following rollover of futures contracts. Intermediate trend remains down. Strength relative to the S&P 500 Index turned positive. Gas moved above its 20 day moving average. Short term momentum indicators are trending up.
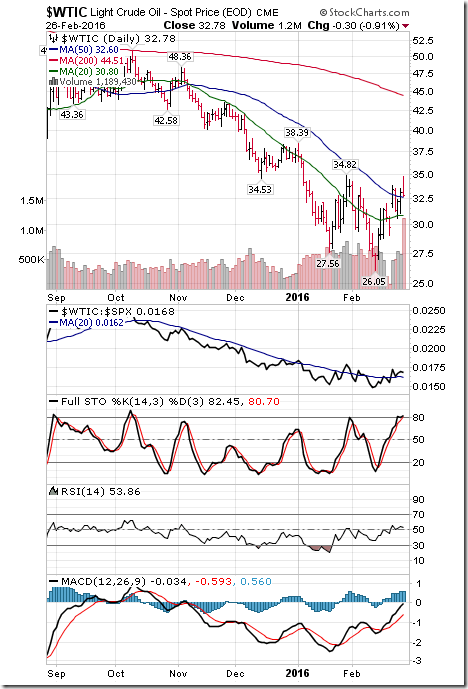
Crude oil gained $1.03 per barrel (3.24%) last week. Intermediate trend remains down. Strength relative to the S&P 500 Index changed to Positive from Neutral. Crude remains above its 20 day moving average. Short term momentum indicators are trending up. Technical score improved last week to 2 from 0.
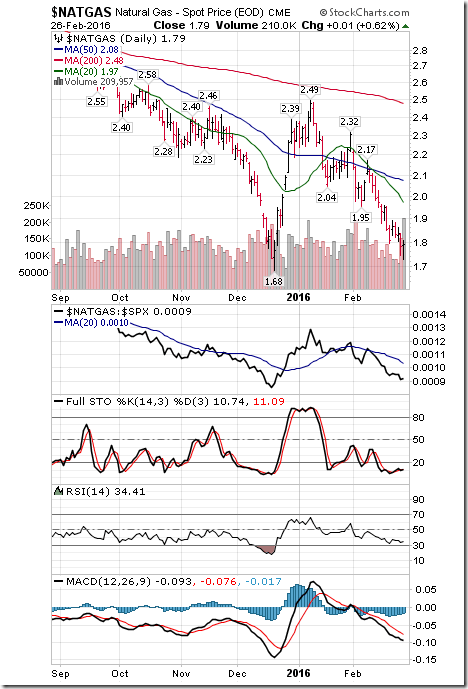
Natural Gas slipped $0.01 per MBtu (0.56%) last week. Intermediate trend remains down. Strength relative to the S&P 500 Index remains negative. “Natty” remains below its 20 day moving average. Short term momentum indicators are trending down. Technical score remained at -6.
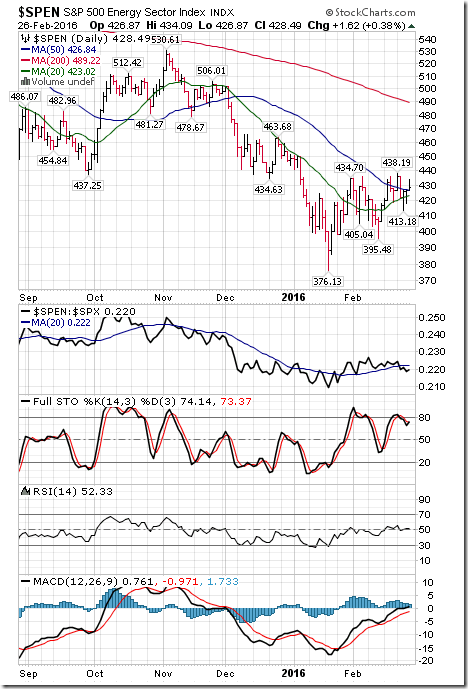
The S&P Energy Index added 1.72 points (0.40%) last week. Intermediate trend remained up. Strength relative to the S&P 500 Index changed to Neutral from Positive. The Index remained above its 20 day moving average. Short term momentum indicators are trending up, but are overbought and showing early signs of peaking. Technical score slipped to 4 from 6.
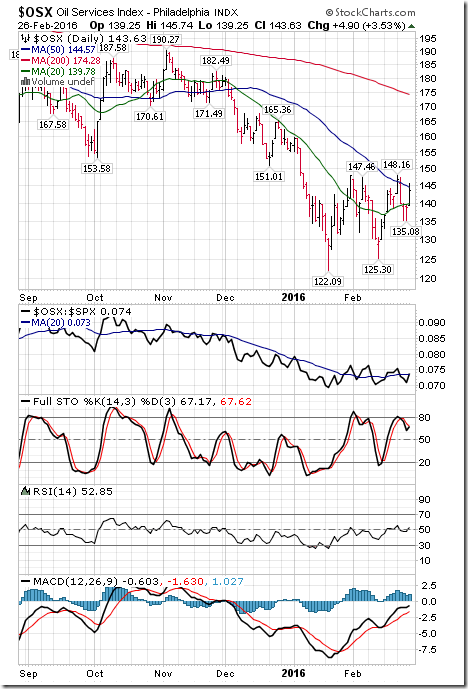
The Philadelphia Oil Services Index gained 1.67 points (1.18%) last week. Intermediate trend changed to up from down on a move above 147.46. Strength relative to the S&P 500 Index remained Neutral. The Index moved back above its 20 day moving average on Friday. Short term momentum indicators are trending up, but are overbought and showing early signs of peaking. Technical score improved last week to 4 from 0.
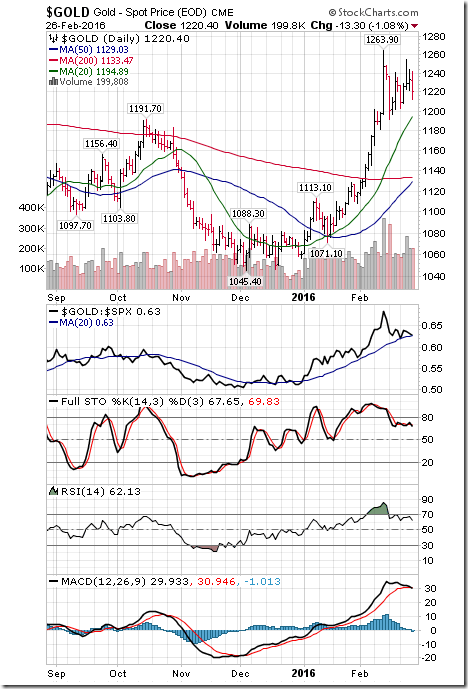
Gold lost $10.90 per ounce (0.89%) last week. Intermediate trend remains up. Strength relative to the S&P 500 Index changed to Neutral from Positive. Gold remains above its 20 day moving average. Short term momentum indicators are trending down. Technical score dropped last week to 2 from 6.
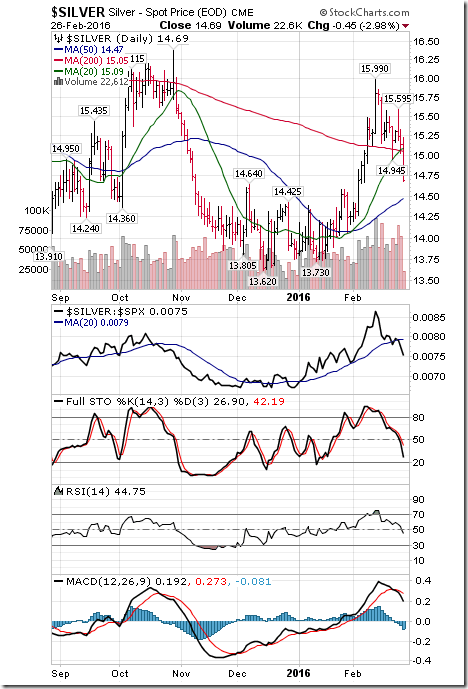
Silver dropped $0.68 per ounce (4.42%) last week. Intermediate trend remains up. Strength relative to the S&P 500 Index changed to Negative from Positive. Silver dropped below its 20 day moving average on Friday. Short term momentum indicators are trending down. Technical score dropped last week to -2 from 6.
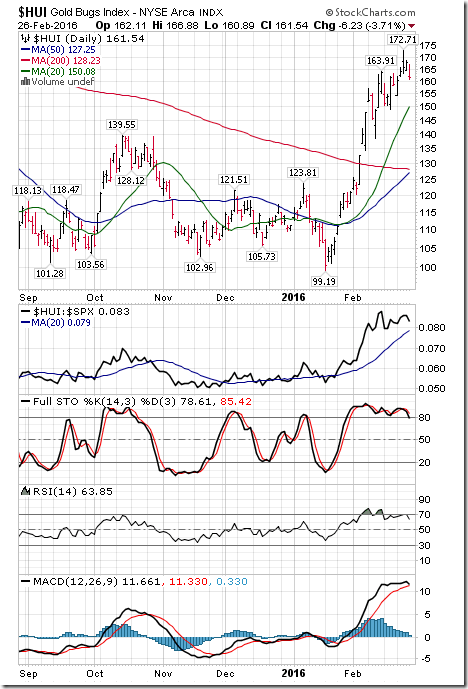
The AMEX Gold Bug Index added 3.39 points (2.14%) last week. Intermediate trend remains up. Strength relative to the S&P 500 Index changed to Neutral from Positive. The Index remains above its 20 day moving average. Short term momentum indicators are trending down. Technical score slipped last week to 2 from 4.
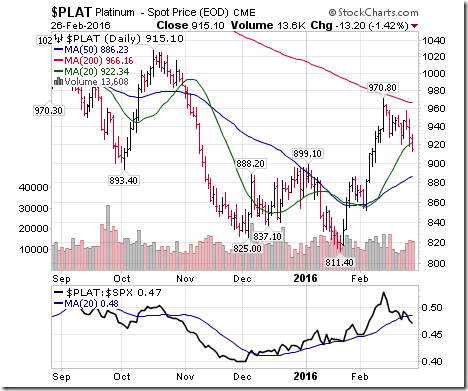
Platinum dropped $30.50 per ounce (3.23%) last week. Trend remained Neutral. Relative strength changed to Neutral from Positive. Broke below 20 day MA on Friday.
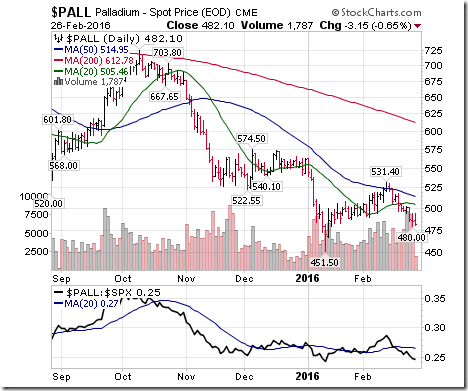
Palladium dropped $16.95 per ounce (3.40%) last week. Strength relative to the S&P 500 Index changed to Negative from Neutral. PALL remained below its 20 day moving average. Short term momentum indicators are trending down. Technical score dropped to -6 from -4.
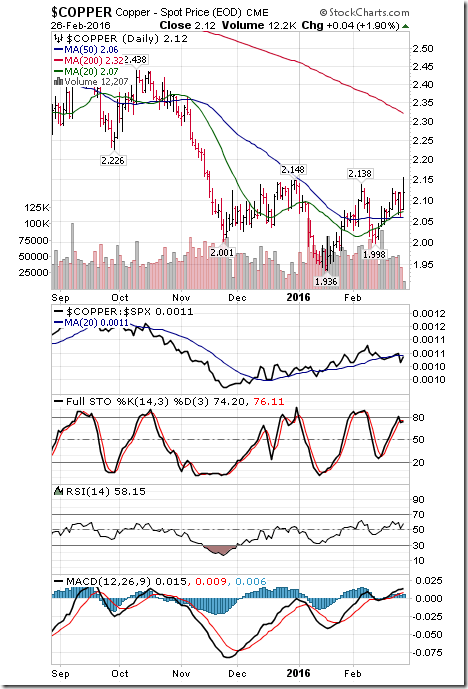
Copper added $0.04 per lb. (1.92%) last week. Intermediate trend remains down. Strength relative to the S&P 500 Index is Negative. Copper remained above its 20 day moving average. Short term momentum indicators are trending up. Technical score dropped last week to -2 from 2.
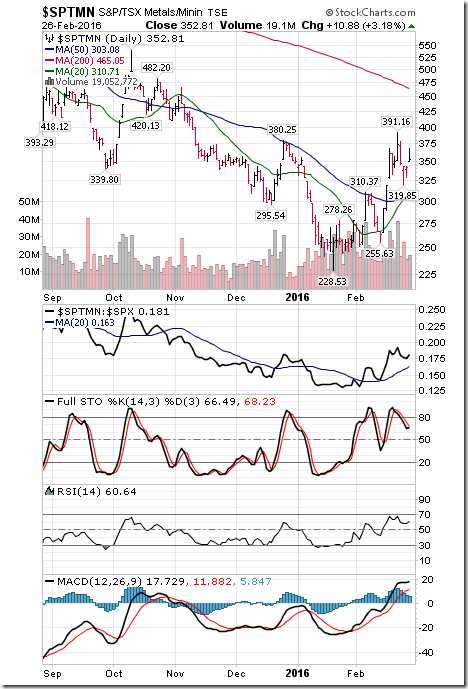
The TSX Metals & Minerals Index added 2.60 points (0.74%) last week. Intermediate trend remains up. Strength relative to the S&P 500 Index remains Positive. The Index remains above its 20 day moving average. Short term momentum indicators are trending down. Technical score slipped last week to 4 from 6.
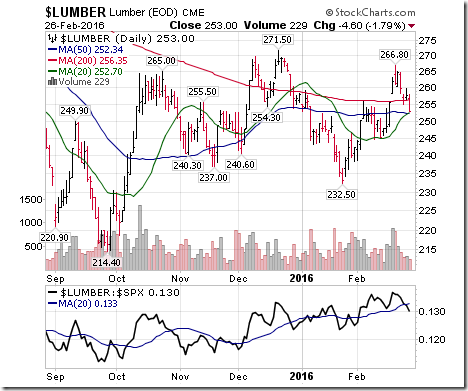
Lumber dropped $9.60 (3.66%) last week. Trend remained Neutral. Relative strength changed to Negative. Lumber remained above its 20 day MA. Short term momentum trending down.
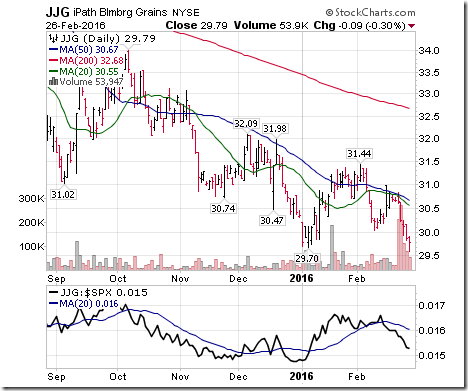
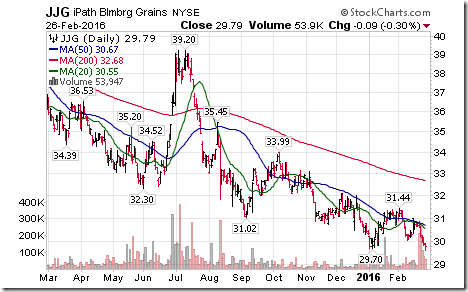
The Grain ETN lost $0.88 (2.87%) last week. Intermediate downtrend confirmed on a move below $29.70. Relative strength remains negative. Units remain below their 20 day moving average. Short term momentum indicators are trending down. Score dropped to -6 from –4
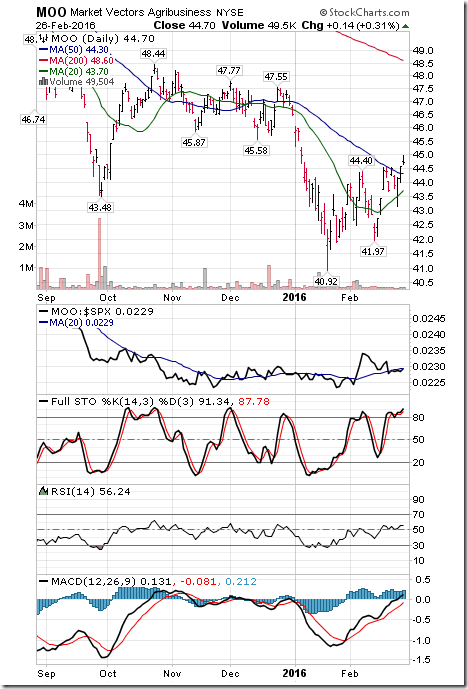
The Agriculture ETF added $1.01 (2.31%) last week. Intermediate trend remains up. Strength relative to the S&P 500 Index remained Neutral. Units remained above their 20 day moving average. Short term momentum indicators are trending up. Technical score remained last week at 4.
Interest Rates
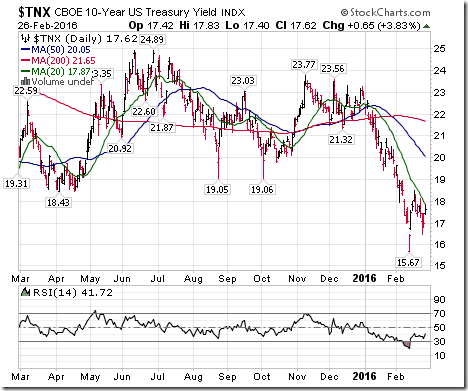
Yield on 10 year Treasuries added 1.4 basis points (0.80%) last week. Intermediate trend remained down. Yield remained below its 20 day moving average. Short term momentum indicators are trending up.
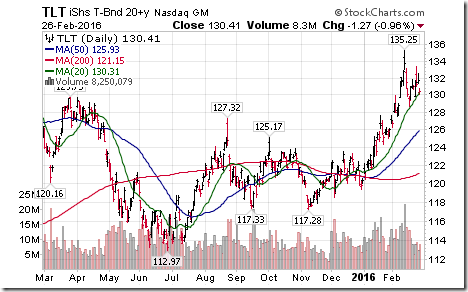
Conversely, price of the long term Treasury ETF slipped $0.58 (0.44%) last week. Intermediate trend remained up. Price remained above its 20 day moving average.
Other Issues
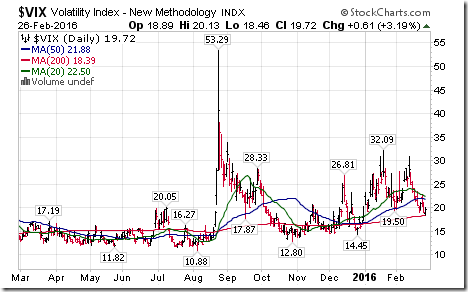
The VIX Index dropped another 0.80 (3.90%) last week. Intermediate trend changed to down from up on a move below 19.50. The Index remained below its 20 day moving average.
Economic news this week focuses on the February ISM report on Tuesday and the January Employment report on Friday. Both are expected to be mildly positive.
Short term momentum indicators are overbought, but have yet to show significant signs of peaking.
International focus is on results from the G20 Meeting over the weekend and China’s February PMI reports (expected to show a slight decline below the 50 level).
Reporting of S&P 500 company fourth quarter results are winding down: 96% have reported to date. Another 11 companies are scheduled to report this week. 69% of companies reported higher than consensus earnings while 48% reported higher than consensus revenues. Blended year=over-year results show a 3.3% decline in Earnings Per Share and a 3.9% decline in revenues.
Consensus estimates for 2016 continue to move lower: 88 companies have issued negative first quarter earnings guidance while 22 companies have issued positive earning guidance. According to FactSet, earnings on a year-over-year basis are expected to drop 7.4% in the first quarter and 1.6% in the second quarter, but a gain of 4.7% in the third quarter and a gain of 4.7% in 9.4%. Revenues on a year-over-year basis are expected to slip 0.6% in the first quarter, slip 0.6% in the second quarter, but gain 1.9% in the third quarter and gain 4.7% in the fourth quarter.
Technical action by individual S&P 500 stocks remained bullish last week: 77 stocks broke intermediate resistance levels while only 4 stocks broke support. Bullish technical action by individual S&P 500 stocks is expected to continue.
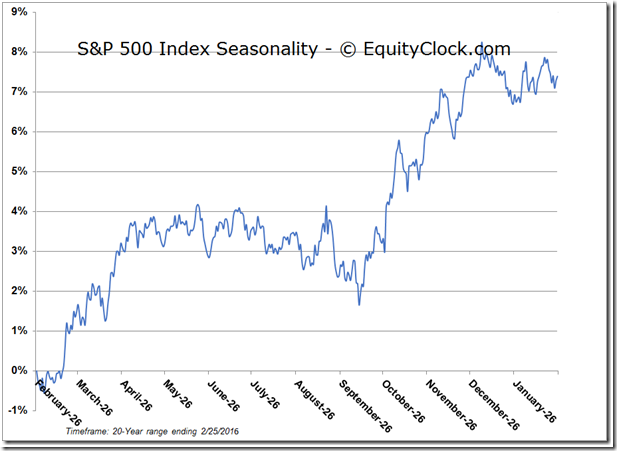
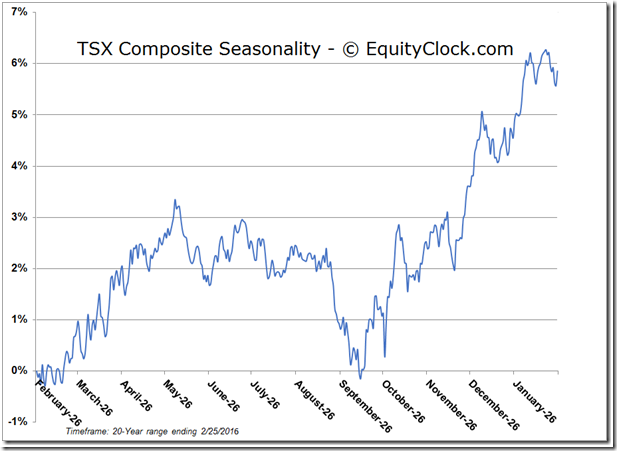
Seasonal influences are positive for most equity markets and economic sectors between now (starting this week) and the end of May.
Sectors
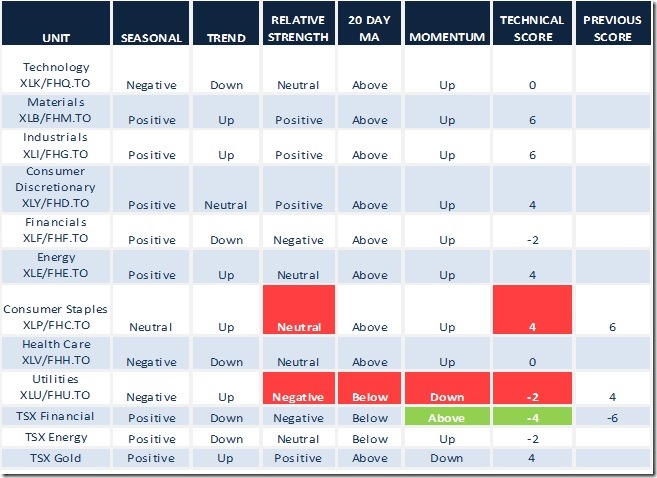
Daily Seasonal/Technical Sector Trends for February 26th 2016
Green: Increase from previous day
Red: Decrease from previous day
StockTwits Released on Friday
S&P 500 breaks above resistance at 1950 as Consumer Staples and Utilities charts new 52 week highs.
Technical action by S&P 500 stocks to 10:00: Bullish. Breakouts: $AET. $$AVY, $DRI, $FFIV, $KHC, $KLAC, $LRCX, $MDT, $SNDK, $UHS, $UNM.
Editor’s Note: After 10:00 AM EST, breakouts included CAH, EMC, HUM, JCI and WHR. Breakdowns included SWN and POM
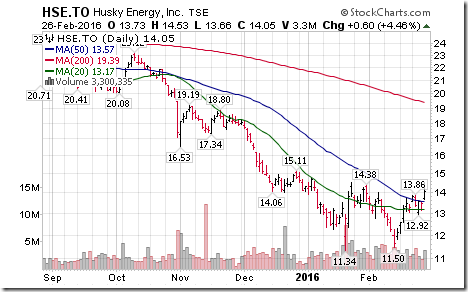
Nice breakout by Husky Energy $HSE.CA to complete a base building pattern!
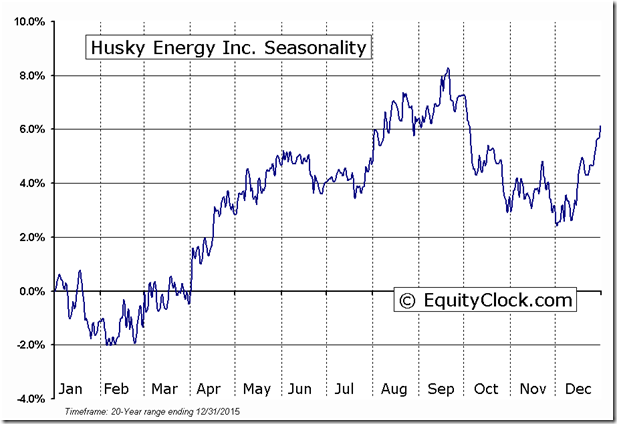
‘Tis the season for Husky Energy $HSE.CA to move higher into May!
Grain ETN $JJG broke support at $29.70 to reach an all-time low.
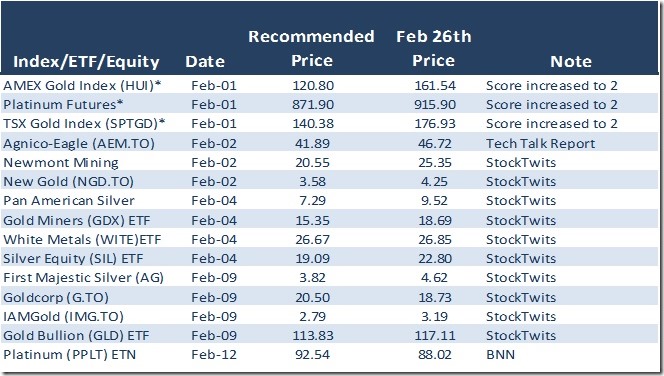
Accountability Report
Profit taking /liquidation by trading accounts is recommended in the following precious metal indices/ETFs/individual equities following previous favourable seasonal/technical comments:
* Recommended more than once. Only initial recommendation are included.
Background
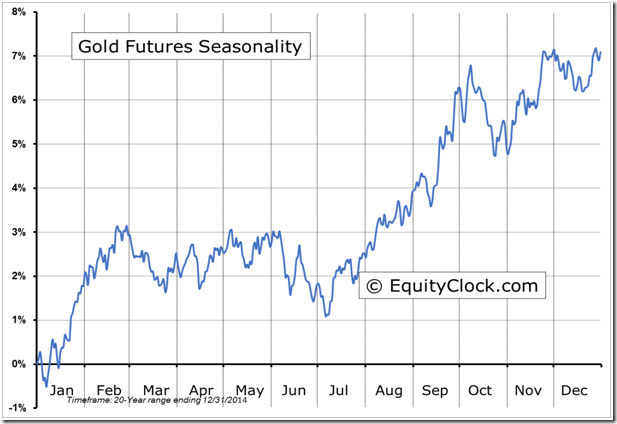
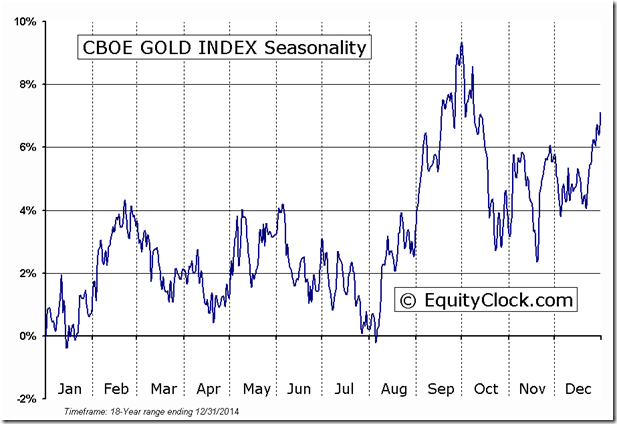
Technical scores for gold bullion/ETFs/equities deteriorated late last week.
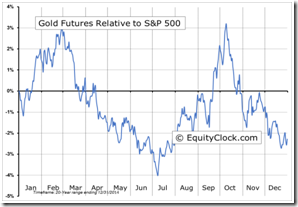
The period of seasonal strength for Gold Bullion and Gold Equities has ended on a real and relative basis.
FUTURE_GCI Relative to the S & P 500
Disclaimer: Seasonality and technical ratings offered in this report by www.timingthemarket.ca and www.equityclock.com are for information only. They should not be considered as advice to purchase or to sell mentioned securities. Data offered in this report is believed to be accurate, but is not guaranteed
Copyright © DV Tech Talk, Timingthemarket.ca


