How Extreme It Is
by Anthony Valeri, Investment Strategist, LPL Financial
KEY TAKEAWAYS
· The speed and magnitude of the decline in the 10-year Treasury yield witnessed in recent weeks is very rare and usually in response to stock market stress.
· Over the past 20 years, Treasury strength has typically faded, but not reversed, following such bouts of quick gains.
· Risk assets, such as stocks, high-yield bonds, and emerging markets debt, typically encountered more headwinds over the short term before recovering 6 to 12 months after.
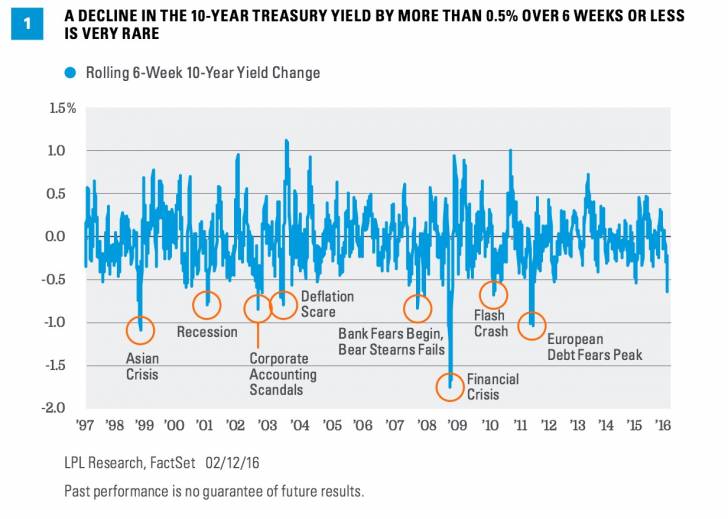
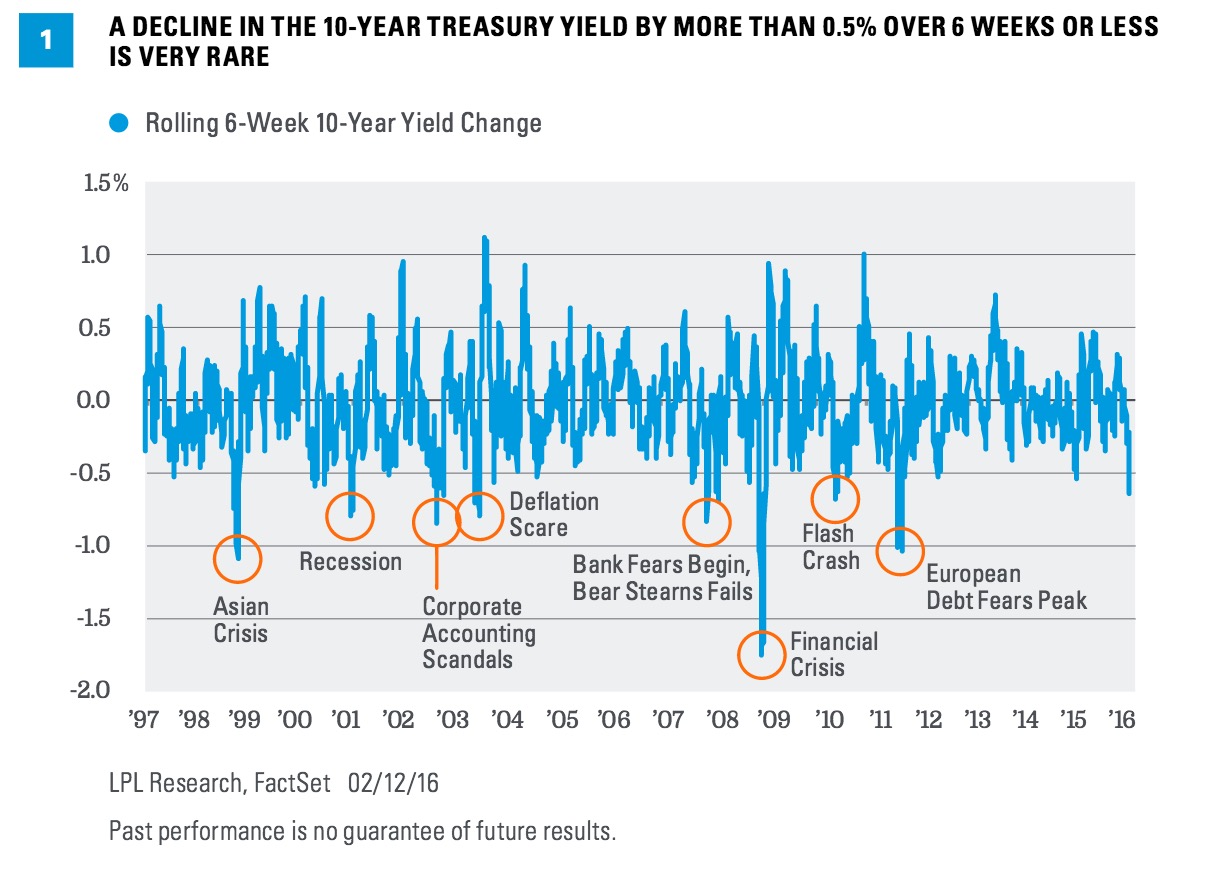
The 10-year Treasury yield has fallen by 0.6% over the past six weeks, a very rare occurrence. Going back 20 years, such a noteworthy yield decline over such a short period of time has occurred only 2% of the time since February 1996. Figure 1 illustrates not only the rarity of such large yield declines, but also the significant events that pushed high-quality bond prices higher and yields lower. Recessions or global crises are the most frequent catalyst, although the current episode has no single driver. China growth fears, oil prices, sluggish U.S. economic growth, and most recently, bank credit fears, have each played a role in driving Treasury strength.

RECESSION WARNING…
Oncoming recessions have triggered big Treasury yield declines in the past. The largest drop in the 10-year yield over the last 20 years (which maxed out at a drop of 1.75% between November and December 2007) came, no surprise, in the run-up to the financial crisis. Another significant decline occurred in the lead-up to the technology bubble of 2000, the terrorist attacks of 2001, and the subsequent recession. In both cases, Federal Reserve (Fed) rate cuts added momentum to Treasury gains.
However, a significant drop in Treasury yields is not, on its own, a good leading indicator for recession. As Figure 1 also illustrates, high-quality bonds saw bursts of robust gains and yield declines on several other occasions that did not precede or accompany recessions.
…BUT NOT FOOLPROOF
However, most Treasury yield declines did happen during periods of equity market weakness; and, on average, equity markets dropped 13% during the 3 months prior to a 10-year yield decline of at least 0.6%. Markets witnessed gains in the preceding 3 months in only 9% of cases, showing that a pullback in equity markets, and subsequent buying of high-quality assets such as Treasuries, was the driver of the large drop in yields. This time is no exception; the S&P 500 has fallen nearly 12% over the past 3 months—in keeping with the historical pattern.
IT’S DARKEST BEFORE DAWN
While it is good to know what types of events can cause steep declines in Treasury yields, it’s more important to determine what such a drop means for the future. The record over the last 20 years is fairly consistent, but two takeaways stand out:
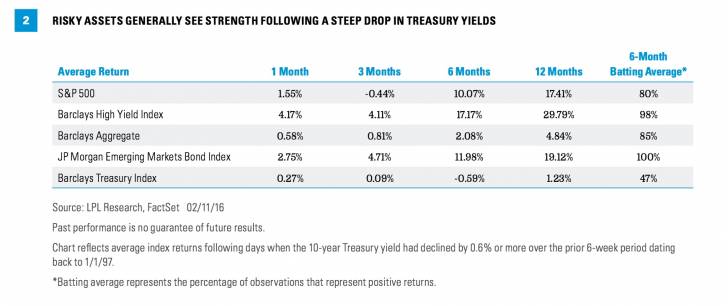
1) Periods of extreme Treasury gains do not necessarily reverse over the short term. Performance slows but remains positive over subsequent 1- and 3-month periods [Figure 2]. So even though Treasury strength is extreme, high-quality bonds generally hold onto the gains over the short term.

2) Over the longer 6- to 12-month time frame, risk assets or more economically sensitive sectors, such as stocks, high-yield bonds, and emerging markets debt, generally recover. Over the short term, stocks show an initial bounce; but over the 3-month period, returns are slightly negative, meaning that challenges linger even after an extreme decline in Treasury yields.
While risk assets struggle initially, 6- and 12-month time periods are clearly more favorable, and also indicate a high probability of a positive return (denoted by “batting average,” the percentage of observations that represent positive returns). Based on these observations, it would appear that market sentiment takes some time to turn, but when it does, the returns are generally positive, and can be quite strong.
Treasury prices exhibit the opposite behavior, showing continued strength (and lower yields) in the short term, while returns become negative as yields rise over the 6-month time period. Batting averages do not show the same consistency as risk assets, with positive returns 47% of the time over the 6-month horizon.
One additional point to be aware of is that 32 of the 100 days that saw steep Treasury yield declines occurred during the financial crisis. Taking into account the lower level of yields today, only 2011 and 2008 saw larger relative drops in the 10-year yield; however, performance following such drops was similar, with risk assets outperforming their lower-risk counterparts over the following 6- and 12-month horizons.
CONCLUSION
Investors often look for periods of extreme moves as a signal that a reversal may be at hand, but history shows that extreme moves lower in Treasury yields may persist over the short term. Over the longer-term 6- to 12-month horizon, risk assets have a history of a relatively strong recovery following such a drop. Only time will tell how markets react going forward, but based on history, the coming months may be kinder to markets than the previous few have been.
IMPORTANT DISCLOSURES
The opinions voiced in this material are for general information only and are not intended to provide specific advice or recommendations for any individual. To determine which investment(s) may be appropriate for you, consult your financial advisor prior to investing. All performance reference is historical and is no guarantee of future results. All indexes are unmanaged and cannot be invested into directly.
The economic forecasts set forth in the presentation may not develop as predicted and there can be no guarantee that strategies promoted will be successful.
Risks inherent to investments in stocks include the fluctuation of dividend, loss of principal, and potential liquidity of the investment in a falling market.
Bonds are subject to market and interest rate risk if sold prior to maturity. Bond values and yields will decline as interest rates rise, and bonds are subject to availability and change in price.
Government bonds and Treasury bills are guaranteed by the U.S. government as to the timely payment of principal and interest and, if held to maturity, offer a fixed rate of return and fixed principal value. However, the value of fund shares is not guaranteed and will fluctuate.
High-yield/junk bonds (grade BB or below) are not investment grade securities, and are subject to higher interest rate, credit, and liquidity risks than those graded BBB and above. They generally should be part of a diversified portfolio for sophisticated investors.
International debt securities involve special additional risks. These risks include, but are not limited to, currency risk, geopolitical and regulatory risk, and risk associated with varying settlement standards. These risks are often heightened for investments in emerging markets.
INDEX DESCRIPTIONS
The Barclays U.S. Corporate High Yield Index measures the market of USD-denominated, noninvestment-grade, fixed-rate, taxable corporate bonds. Securities are classified as high yield if the middle rating of Moody’s, Fitch, and S&P is Ba1/BB+/BB+ or below, excluding emerging market debt.
The Barclays U.S. Aggregate Bond Index is a broad-based flagship benchmark that measures the investment-grade, U.S. dollar-denominated, fixed-rate taxable bond market. The index includes Treasuries, government-related and corporate securities, MBS (agency fixed-rate and hybrid ARM pass-throughs), ABS, and CMBS (agency and non-agency).
The JP Morgan Emerging Markets Bond Index is a benchmark index for measuring the total return performance of international government bonds issued by emerging markets countries that are considered sovereign (issued in something other than local currency) and that meet specific liquidity and structural requirements.
The Barclays U.S. Treasury Index is an unmanaged index of public debt obligations of the U.S. Treasury with a remaining maturity of one year or more. The index does not include T-bills (due to the maturity constraint), zero coupon bonds (strips), or Treasury Inflation-Protected Securities (TIPS).
The S&P 500 Index is a capitalization-weighted index of 500 stocks designed to measure performance of the broad domestic economy through changes in the aggregate market value of 500 stocks representing all major industries.
This research material has been prepared by LPL Financial.
To the extent you are receiving investment advice from a separately registered independent investment advisor, please note that LPL Financial is not an affiliate of and makes no representation with respect to such entity.


