by Don Vialoux, Timingthemarket.ca
Technical Action by S&P 500 Stocks Yesterday
Action by bullish across all sectors except Utilities! Another 47 S&P 500 stocks moved above short term base building patterns. None broke support.
Trader’s Corner
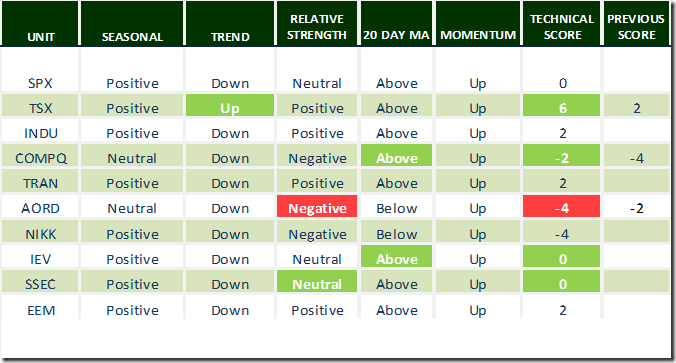
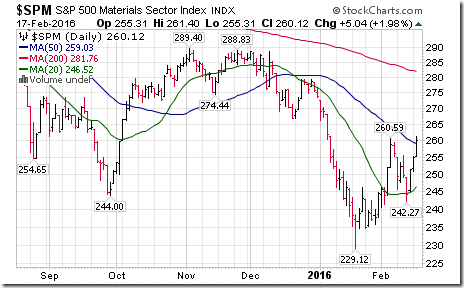
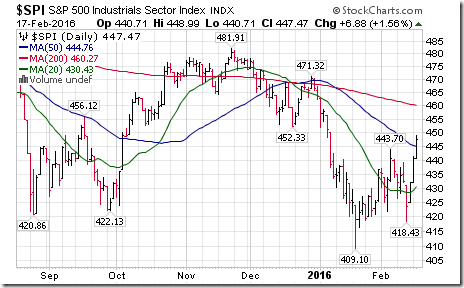
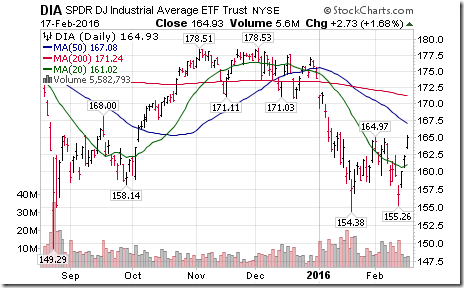
Technical scores rose strongly again yesterday. This time, scores mainly moved higher because of a change in trend and relative strength. Below are examples.
Daily Seasonal/Technical Equity Trends for February 17th 2016
Green: Increase from previous day
Red: Decrease from previous day
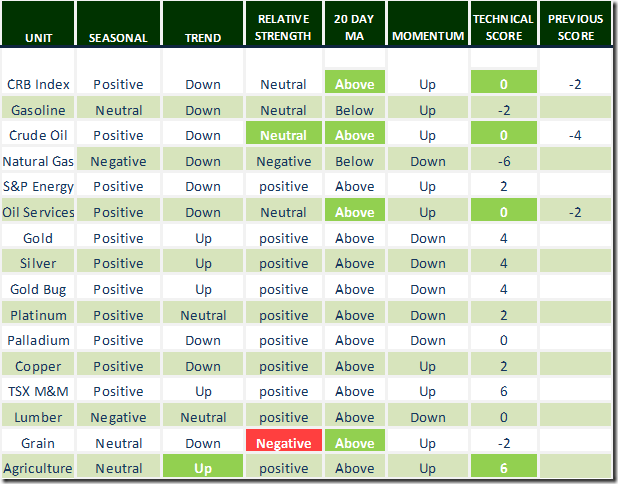
Daily Seasonal/Technical Commodities Trends for February 17th 2016
Green: Increase from previous day
Red: Decrease from previous day
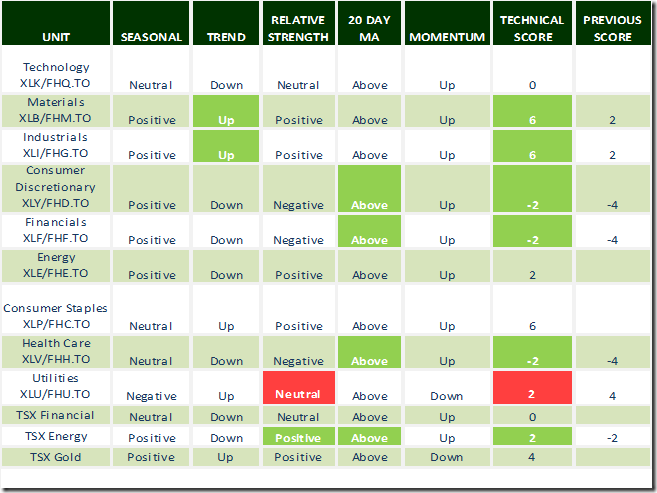
Daily Seasonal/Technical Sector Trends for February 17th 2016
Green: Increase from previous day
Red: Decrease from previous day
Charts that recorded exceptional gains in technical score yesterday
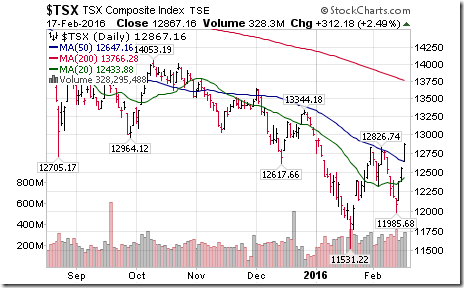
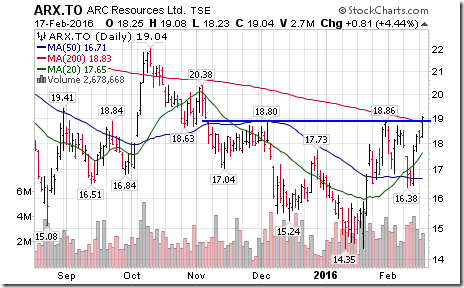
The following saw their technical score jump to 6 from 2 when their trend changed to up from down on a breakout above their recent trading range:
Other Interesting Charts
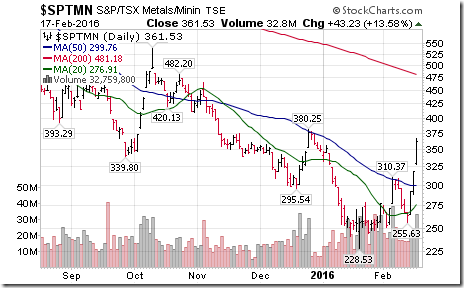
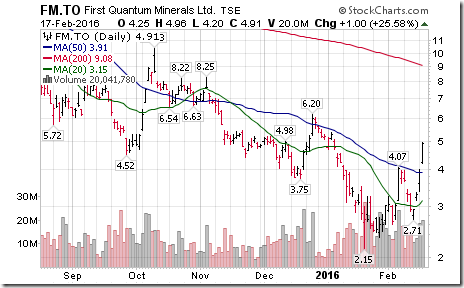
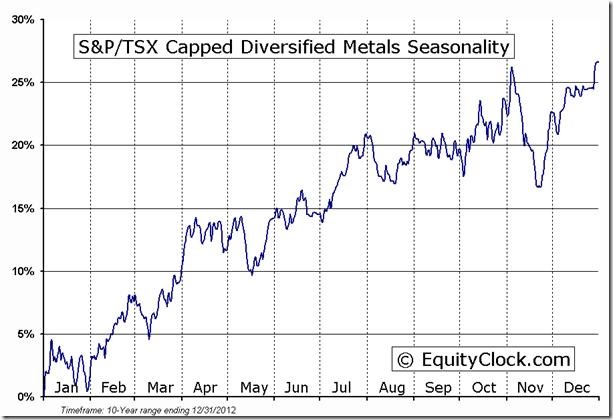
Some of the more spectacular moves yesterday occurred in the base metal sector. The TSX Metals & Mining Index tacked on a healthy 13.58%. A wide variety of producing base metal stocks broke above short term base building patterns including BHP Billiton, Rio Tinto, Lundin Mining and HudBay Minerals. The star performer was First Quantum Minerals, up 25.58%. ‘Tis the season for Base Metal stocks!
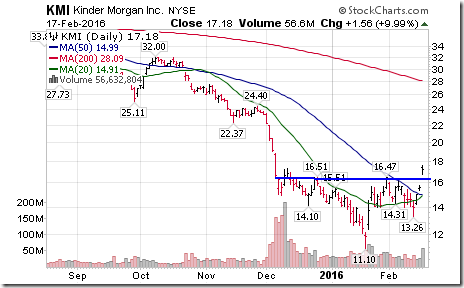
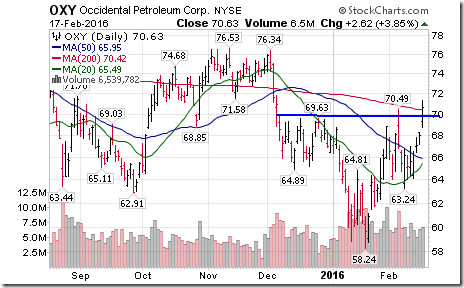
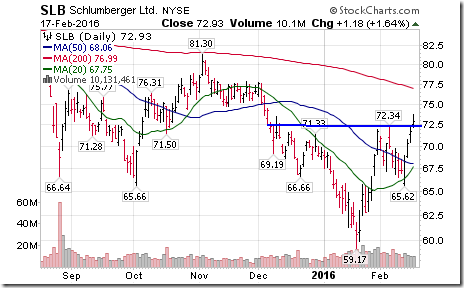
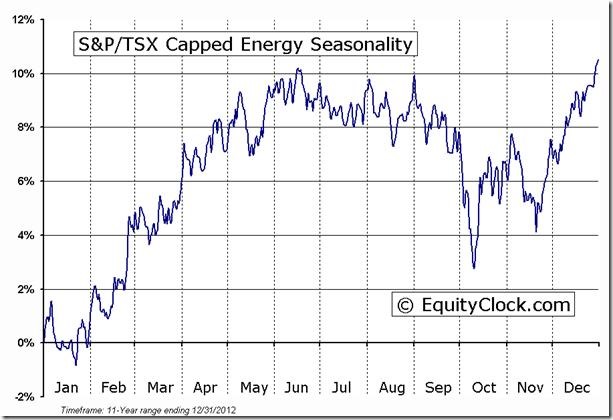
Several energy stocks completed classic base building patterns (mostly reverse head and shoulders patterns:
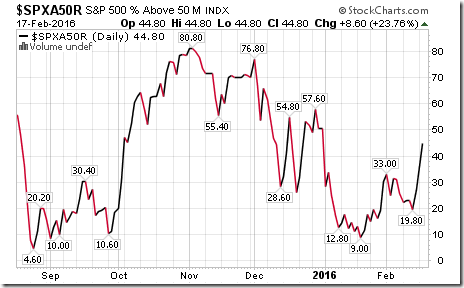
Percent of S&P 500 stocks trading above their 50 day moving average continues to soar.
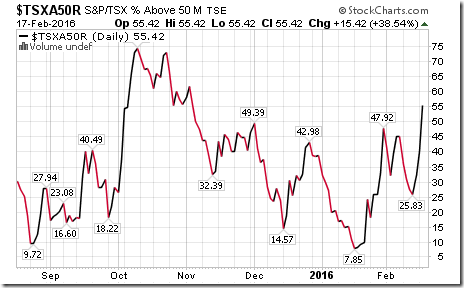
Ditto for Percent of TSX stocks trading above their 50 day moving average.
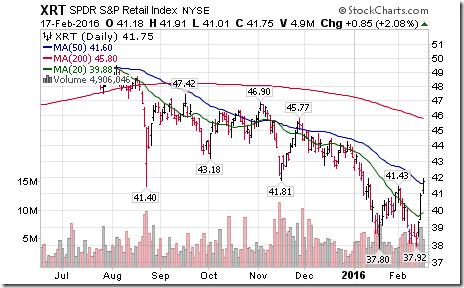
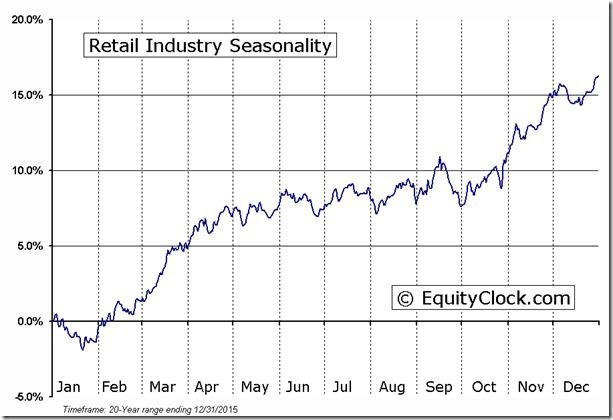
Interest in U.S. Retail stocks has surfaced just as the period of seasonal strength for the sector (spring buying season) is about to start.
Special Free Services available through www.equityclock.com
Equityclock.com is offering free access to a data base showing seasonal studies on individual stocks and sectors. The data base holds seasonality studies on over 1000 big and moderate cap securities and indices. To login, simply go to http://www.equityclock.com/charts/ Following are examples:
Disclaimer: Seasonality and technical ratings offered in this report by www.timingthemarket.ca and www.equityclock.com are for information only. They should not be considered as advice to purchase or to sell mentioned securities. Data offered in this report is believed to be accurate, but is not guaranteed
|
|
|
Copyright © DV Tech Talk, Timingthemarket.ca


