by Don Vialoux, Timingthemarket.ca
StockTwits Released Yesterday
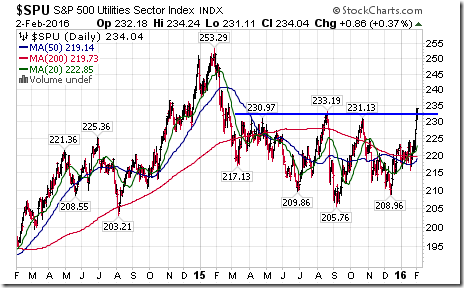
Utilities sector breakout, moving above massive base building pattern as investors remain averse.
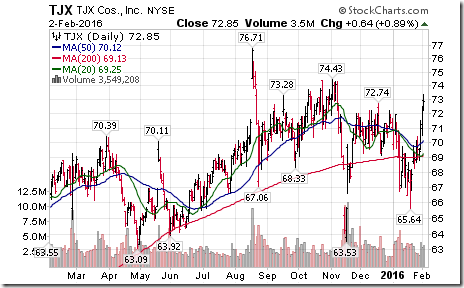
Technical action by S&P 500 stocks to 10:15: Surprisingly bullish despite fall by the Index. Breakouts: $KORS, $MAT, $TJX, $GOOG, $GOOGL.
Editor’s Note: After 10:15 AM EST, Paypal and HCA broke resistance and Electronic Arts broke support
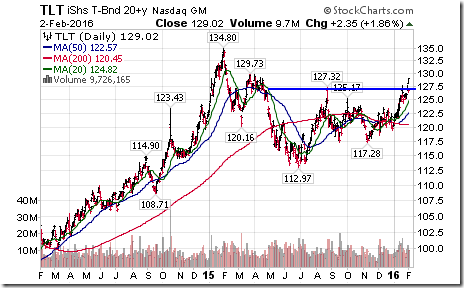
Nice breakout by $TLT above $127.32 to resume an intermediate uptrend!
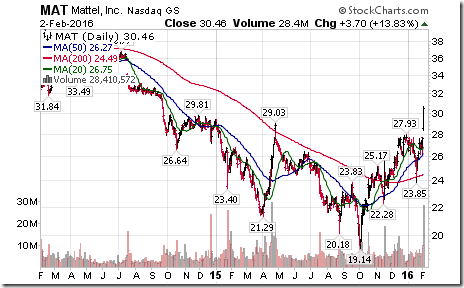
Nice breakout by $MAT above $29.03 to a 16 month high!
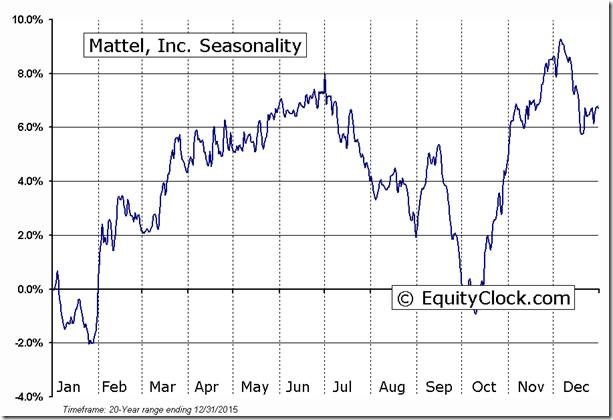
‘Tis the season for Mattel to move higher until April!
Nice breakout by $TJX above $72.74 to resume an intermediate uptrend!
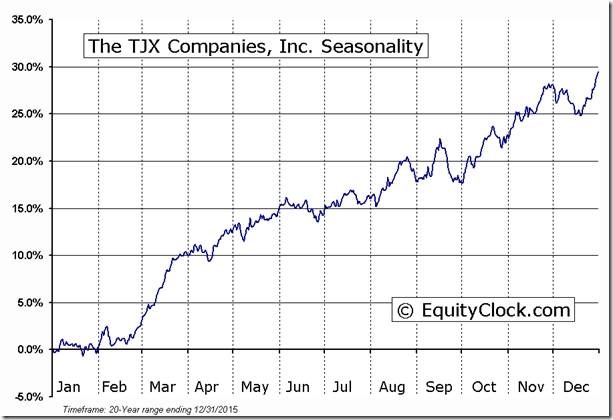
‘Tis the season for TJX to move higher until the beginning of June!
Trader’s Corner
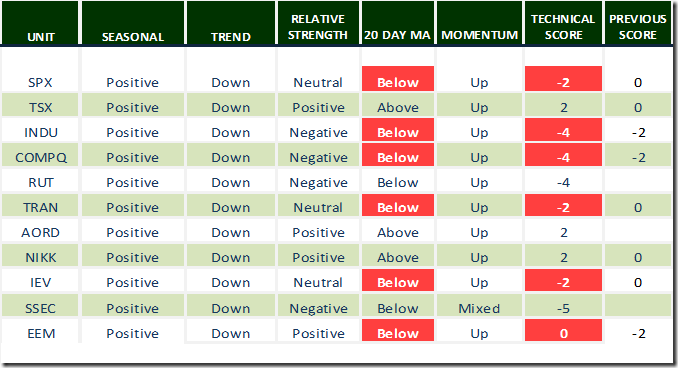
Technical score dropped significantly yesterday when a wide variety of markets, commodities and sectors fell below their 20 day moving average.
Daily Seasonal/Technical Equity Trends for February 2nd 2016
Green: Increase from previous day
Red: Decrease from previous day
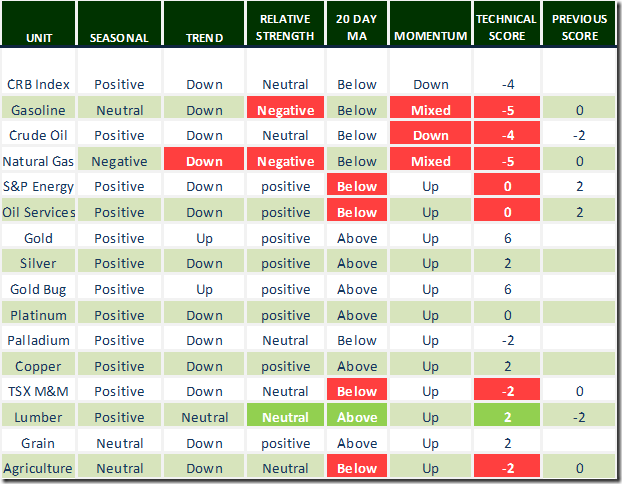
Daily Seasonal/Technical Commodities Trends for February 2nd 2016
Green: Increase from previous day
Red: Decrease from previous day
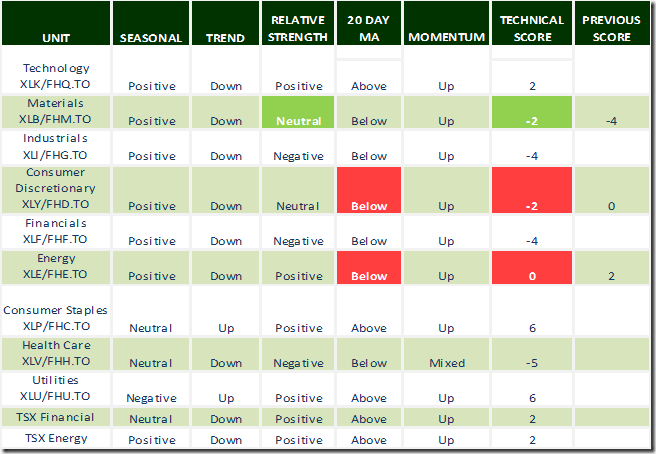
Daily Seasonal/Technical Sector Trends for February 2nd 2016
Green: Increase from previous day
Red: Decrease from previous day
FP Trading Desk Headline
FP Trading Desk headline reads, “Gold’s rise in January bodes well for commodities for rest of 2016”. Following is a link:
Special Free Services available through www.equityclock.com
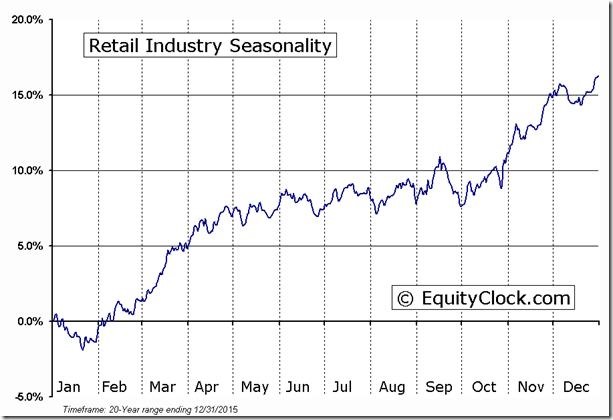
Equityclock.com is offering free access to a data base showing seasonal studies on individual stocks and sectors. The data base holds seasonality studies on over 1000 big and moderate cap securities and indices. To login, simply go to http://www.equityclock.com/charts/ Following is an example:
Interesting Charts
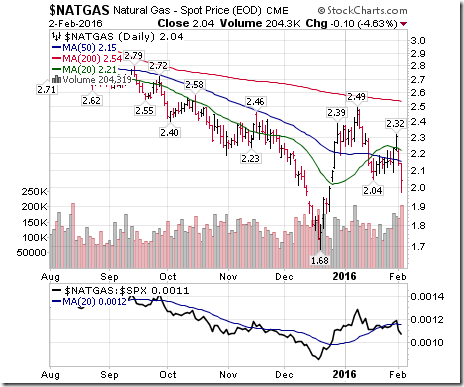
Brutal day for natural gas: Broke support, relative strength turned negative, recently dropped below its 20 day moving average and short term momentum indicators have rolled over.
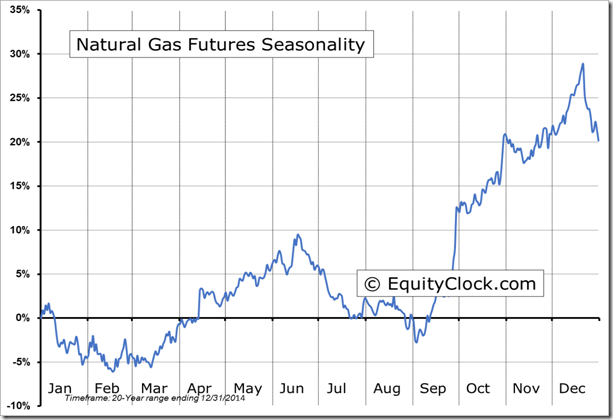
Seasonal influences for natural gas are negative at this time of year.
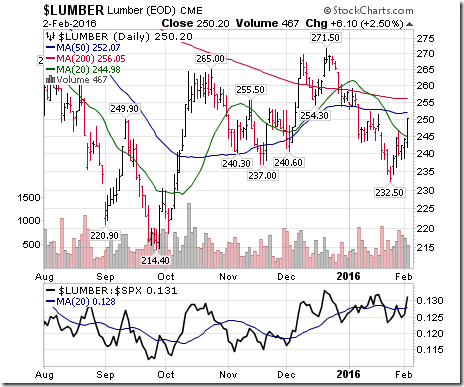
Lumber was an interesting anomaly, moving higher in a rough equity market.
Disclaimer: Seasonality and technical ratings offered in this report by www.timingthemarket.ca and www.equityclock.com are for information only. They should not be considered as advice to purchase or to sell mentioned securities. Data offered in this report is believed to be accurate, but is not guaranteed.
Copyright © DV Tech Talk, Timingthemarket.ca


