Saved by the bell
by Jeffrey Saut, Chief Investment Strategist, Raymond James
January 25, 2016
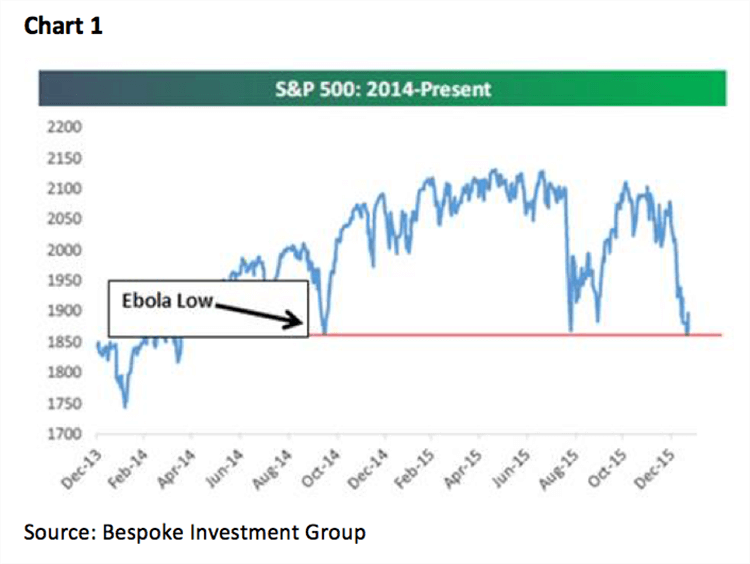
“Saved by the Bell” except in this case we are not referring to the late-1980s TV sitcom that focused on a group of high school teens and their principal, but last Wednesday’s closing bell on the floor of the New York Stock Exchange (NYSE). The day began well enough with the preopening S&P futures only off about 9 points when I slid into my trading turret around 5:30 a.m. From there, however, things got pretty ugly as the D-J Industrial Average (INDU/16093.51) went into a minicrash that would see the senior index shed some 567 points and in the process break below its August 25, 2015 closing low of 15666.44. Of course my phone, and email box, lit up with the ubiquitous question, “Hey Jeff, you chose to ignore the Dow Theory ‘sell signal’ of last August unless both the Industrials and the D-J Transports (TRAN/6778.54) broke below those lows. Well the Transports broke their August low last December and today the Industrials are doing the same. Do we raise more cash here?” The question was so prolific that I ended up cutting and pasting this response, “Intraday ‘price prints’ do not count in Dow Theory. It’s only the closing price that counts. Yet, if the Dow closes below 15666.44 I will have to go through my portfolio and look at the weakest stocks that have broken below major support levels and at least sell half of the position.” Fortunately, in Wednesday afternoon’s trading we got a stock market lift, leaving the Industrials at 15766.74, so I didn’t have to execute on that strategy. The next day, however, I got pounded again.
Thursday’s questions were driven by an article from The Street.com. The title read, “A ‘Dow Theory Sell Signal Suggests the ‘Year of the Bear’ Will Continue,” and was actually written by a very bright strategist I know, as he wrote:
This economically sensitive Dow Industrials closed at 15,766.74, below the prior closing low of 15,871.35 set on Aug. 24, considered Black Monday in China. [The] Dow Transports already closed below its Aug. 24 close of 7,595.08 back on Dec. 11 with a close of 7,524.64. This set up [is] a potential "Dow Theory Sell Signal" when the Dow Industrials followed (see the article here: (Suttmeier).
While he has the right closing prices for August 24, 2015, he has the wrong date for the closing lows of both indices. As often stated in these missives, the low closing prices for both the Industrials and the Trannies occurred on August 25, 2015, not on the 24th. To be sure on August 25th the Industrials closed at 15666.44 and the Transports at 7466.97. Hence, while the Trannies fell below their August low on December 18, 2015, the Industrials have yet to close below their respective August low.
On that same day I was also pounded with emails wanting to know where I saw that Goldman Sachs was telling clients to “buy” crude oil and did I think oil had bottomed? Hereto, I cut and pasted this response, “I have wrongly attempted to ‘call’ the bottom on oil three times last year and been wrong every time, so I am deferring to my energy analysts that say their model is more bullish than at any time in the past four years. They are looking for higher oil prices in the back half of this year.” As for Goldman’s bullish oil call, you can see that here (Oxford World Financial Digest); and, so far Goldman has been right as the March crude oil futures contract has rallied some 23% from last Wednesday’s intraday low into Friday’s intraday high. Of course such a rally in crude has produced rallies in the energy stocks (the average energy stock is up 22% from last Wednesday’s lows). Of particular interest to us is the recent rally in the mid/downstream master limited partnerships (MLPs). For the past few weeks we have suggested that investors have been able to buy an investment grade portfolio of such MLPs with an aggregate yield of over 7%, some of which is tax deferred because it is classified as return of capital. As always, names and fundamentals should be vetted before purchase.
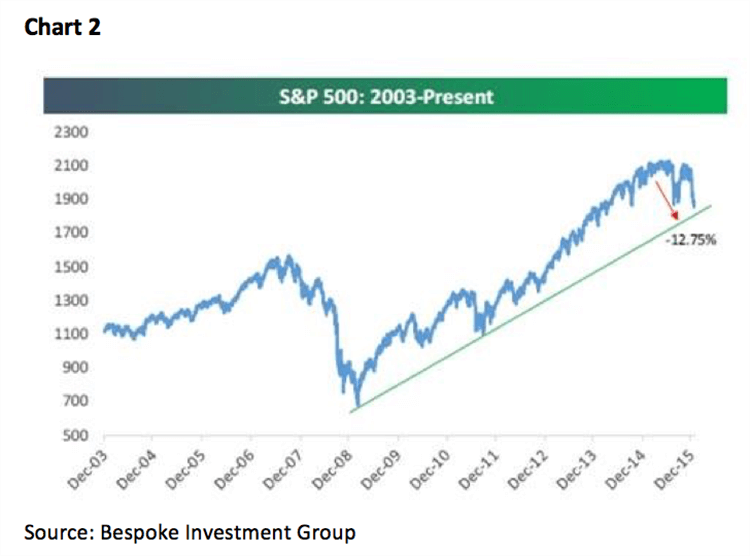
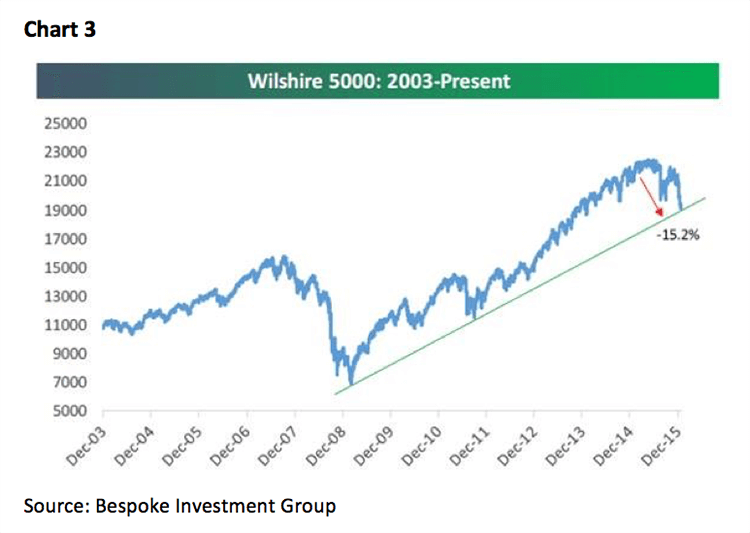
So what happened late last week that gave us the first back-to-back “two step” (Thursday/Friday) in months that added some 327 points to the Dow? As I stated a couple of times on TV last week, I think the “fuel” was the surprisingly large $60 billion liquidity injection by the People’s Bank of China (PBOC) and the “match” was Draghi’s latest iteration of “whatever it takes.” Other metrics setting the stage for a rally were: 1) last Wednesday saw the highest odd-lot short selling by individuals ever (contrary indicator); 2) Google Trends showed searches for the term “bear market” at its highest level since March 2009; 3) stocks above their 50-day moving averages was below 10% (oversold); 4) the NYSE McClellan Oscillator was about as oversold as it ever gets; 5) more than 40% of the stocks traded on the NYSE traded to new 52-week lows on Wednesday (historic); 6) investors pulled $25.6 billion from U.S. stock mutual funds over the past three weeks, and the list goes on. As well, last Wednesday was session 15 in the envisioned “selling stampede” that tends to last 17 – 25 sessions before exhausting itself, which was close enough for government work. Still, so far we have only experienced a two-session “throwback rally.” As stated, such stampedes are only interrupted by one- to three-session pauses/rally attempts, making today extremely important, yet it certainly feels like this rally could last for a while with the SPX’s first target 1940 – 1950.
The call for this week: My friend Arthur Cashin has said, “When the fear of losing money overcomes the fear of looking stupid . . . that’s a bottom!” Last week that is exactly how many folks felt on the Street of Dreams. We’ll see if that mood prevails this week, allowing stocks to trade higher. A step in that direction would be for the major averages to rally for more than just three sessions. As for last weekend’s snow storm, which is being trumpeted as the worst storm for NYC ever, I drudged up the first paragraph from my report titled “The Great White Hurricane.” To wit:
“Unseasonably mild and clearing” was the weather forecast going into the Ides of March back in the year of 1888. And it was true, as temperatures hovered in the 40s and 50s along the East Coast. However, torrential rains began falling, and on March 12th, the rain changed to heavy snow, temperatures plunged, and sustained winds of more than 50 miles per hour blew. The “Great White Hurricane” had begun! In the next 36 hours, some 50 inches of snow would blanket New York City, and the winds would whip that snow into 40- to 50-foot snowdrifts. Telegraph and telephone lines were snapped, fire stations were immobilized, New Yorkers could not get out of their homes, 200 ships were blown aground, and 400 people would die before the storm was over. The resulting transportation crisis led to the construction of New York’s subway system.
P.S. – By far the best prose I read last week was written by Howard Marks of Oaktree Capital (Oaktree):
Especially during downdrafts, many investors impute intelligence to the market and look to it to tell them what’s going on and what to do about it. This is one of the biggest mistakes you can make. As Ben Graham pointed out, the day-to-day market isn’t a fundamental analyst; it’s a barometer of investor sentiment. . . . You just can’t take it too seriously. Market participants have limited insight into what’s really happening in terms of fundamentals, and any intelligence that could be behind their buys and sells is obscured by their emotional swings. It would be wrong to interpret the recent worldwide drop as meaning the market “knows” tough times lay ahead. . . . It’s important to understand for this purpose that there really isn’t such a thing as “the market.” There’s just a bunch of people who participate in a market. The market isn’t more than the sum of the participants, and it doesn’t “know” any more than their collective knowledge.
Copyright © Raymond James


