by Don Vialoux, Timingthemarket.ca
Economic News This Week
December U.S. Housing Starts to be released at 8:30 AM EST on Wednesday are expected to increase to 1,198, 000 units from 1,173,000 units in November.
December U.S. CPI to be released at 8:30 AM EST on Wednesday is expected to be unchanged from November. Excluding food and energy, December CPI is expected to increase 0.2% versus a gain of 0.2% in November.
Bank of Canada interest rate announcement at 10:00 AM EST on Wednesday is expected to reduce the overnight lending rate by 0.25% to 0.25%.
January Philadelphia Fed Index to be released at 8:30 AM EST on Thursday is expected to improve to -3.2 from -10.2 in December.
Weekly Jobless Claims to be released at 8:30 AM EST on Thursday are expected to increase to 285,000 from 284,000 last week.
Canadian December CPI to be released at 8:30 AM EST on Friday is expected to dip 0.3% versus a decline of 0.1% in November. On a year-over-year basis, CPI is expected to increase 1.8%.
Canadian November Retail Sales to be released at 8:30 AM EST on Friday are expected to increase 0.2% versus a gain of 0.1% in October.
December U.S. Existing Home Sales to be released at 10:00 AM EST on Friday are expected to increase 5.20 million units from 4.76 million units in November.
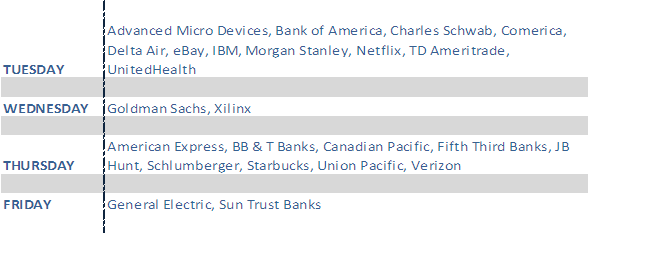
Earnings Reports Next Week
The Bottom Line
Weakness in equity prices around the world related to monetary instability in China continues shock investors. The only sector that created a significant gain on a relative basis last week was gold. Technical signs of a bottom have yet to surface despite momentum indicators that are deeply oversold. Investors will watch closely to responses to “ugly” fourth quarter earnings reports by S&P 500 companies. Consensus is that year-over-year earnings on average will decline by 5.7%. Responses to reports released to date generally have been negative despite slightly better than consensus results. Equity markets will need a period of base building before they once again can move higher. Preferred strategies for now are to “wait until the dust settles” before adding to existing equity positions and to line up candidates for purchase when technical signs of an intermediate bottom surface.
Equity Indices
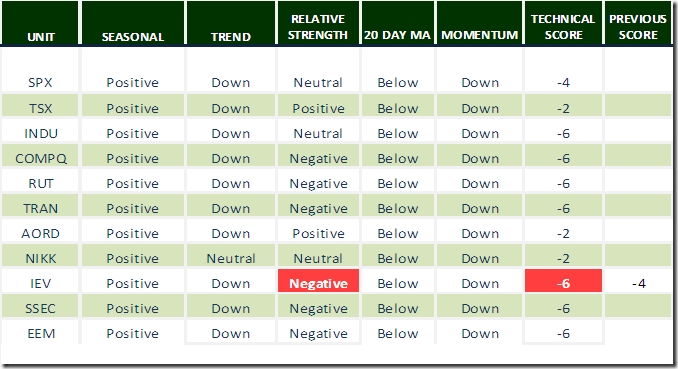
Daily Seasonal/Technical Equity Trends for January 15th 2016
Green: Increase from previous day
Red: Decrease from previous day
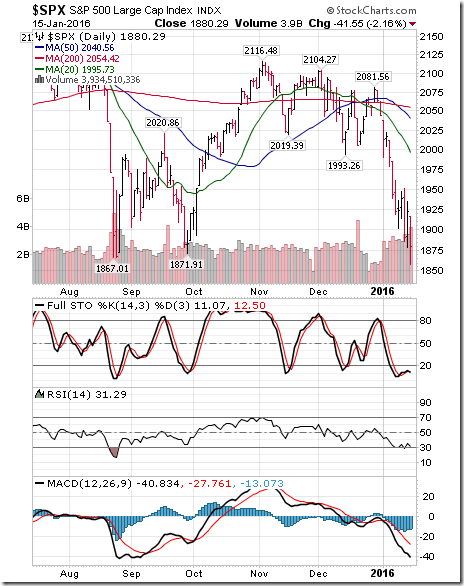
The S&P 500 Index dropped another 41.74 points (2.17%) last week. Intermediate trend remains down. The Index remains below its 20 day moving average. Short term momentum indicators are trending down and are oversold, but have yet to show signs of bottoming.
Calculating Technical Scores
Technical scores are calculated as follows:
Intermediate Uptrend based on at least 20 trading days: Score 2
Higher highs and higher lows
Intermediate Neutral trend: Score 0
Not up or down
Intermediate Downtrend: Score -2
Lower highs and lower lows
Outperformance relative to the S&P 500 Index: Score: 2
Neutral Performance relative to the S&P 500 Index: 0
Underperformance relative to the S&P 500 Index: Score –2
Above 20 day moving average: Score 1
At 20 day moving average: Score: 0
Below 20 day moving average: –1
Up trending momentum indicators (Daily Stochastics, RSI and MACD): 1
Mixed momentum indicators: 0
Down trending momentum indicators: –1
Technical scores range from -6 to +6. Technical buy signals based on the above guidelines start when a security advances to at least 0.0, but preferably 2.0 or higher. Technical sell/short signals start when a security descends to 0, but preferably -2.0 or lower.
Long positions require maintaining a technical score of 0.0 or higher. Conversely, a short position requires maintaining a technical score of 0.0 or lower.
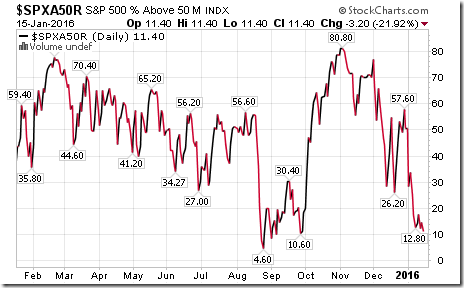
Percent of S&P 500 stocks trading above their 50 day moving average slipped last week to 11.40% from 12.80%. Percent is deeply oversold, but has yet to show signs of bottoming.
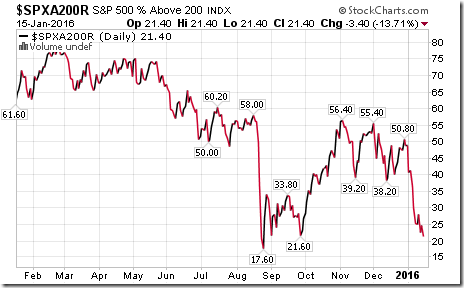
Percent of S&P 500 stocks trading above their 200 day moving average slipped last week to 21.40% from 25.40%. Percent is deeply oversold, but has yet to show signs of bottoming.
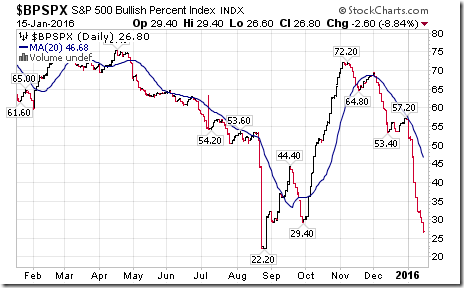
Bullish Percent Index for S&P 500 stocks dropped last week to 26.80% from 36.00% and remained below its 20 day moving average. The Index is intermediate oversold, but has yet to show signs of bottoming.
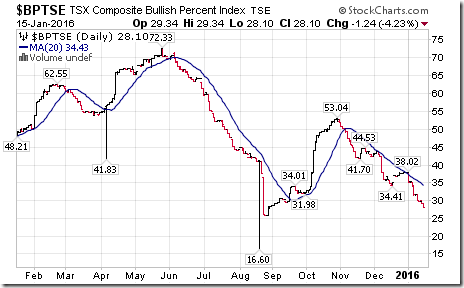
Bullish Percent Index for TSX stocks dropped last week to 28.10% from 31.82% and remained below its 20 day moving average. The Index is intermediate oversold, but has yet to show signs of bottoming.
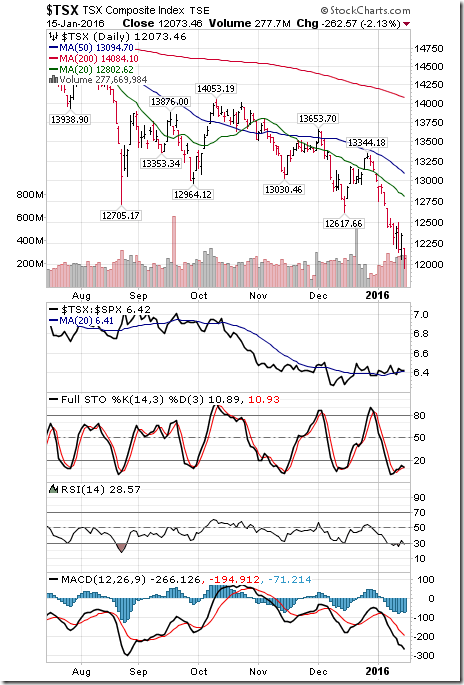
The TSX Composite Index plunged 237.99 points (2.99%) last week. Intermediate trend remains down (Score: -2). Strength relative to the S&P 500 Index remains positive (Score: 2). The Index remains below its 20 day moving average (Score: -1). Short term momentum indicators are trending down (Score: -1) and are oversold, but have yet to show signs of bottoming. Technical score remained at -2.
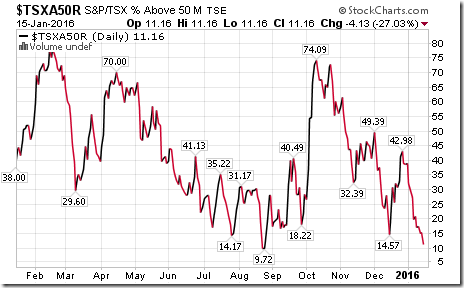
Percent of TSX stocks trading above their 50 day moving average dropped last week to 11.16% from 20.66%. Percent is intermediate oversold, but has yet to show signs of bottoming
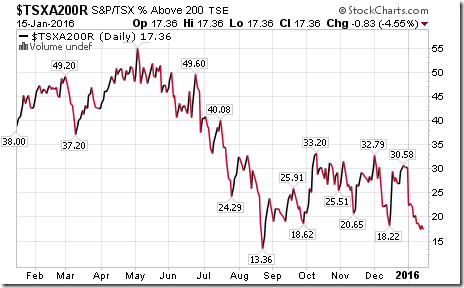
Percent of TSX stocks trading above their 200 day moving average dropped last week to 17.36% from 20.25%. Percent is intermediate oversold, but has yet to show signs of bottoming.
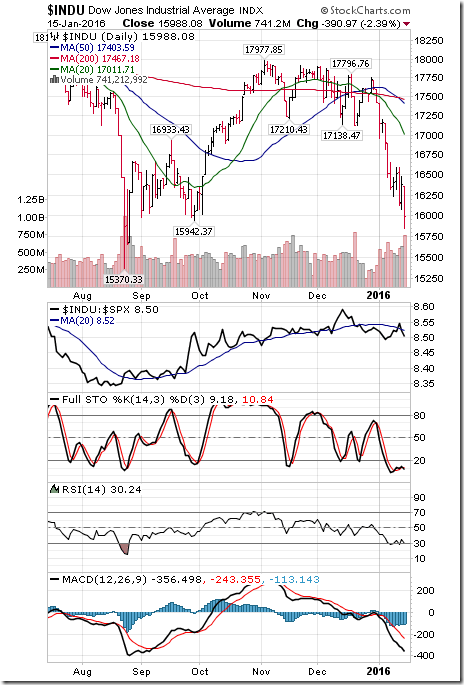
The Dow Jones Industrial Average fell 358.37 points (2.19%) last week. Intermediate trend remains down. Strength relative to the S&P 500 Index improved last week to neutral from negative. The Average remains below its 20 day moving average. Short term momentum indicators are trending down and are oversold, but have yet to show signs of bottoming. Technical score improved last week to -4 from -6.
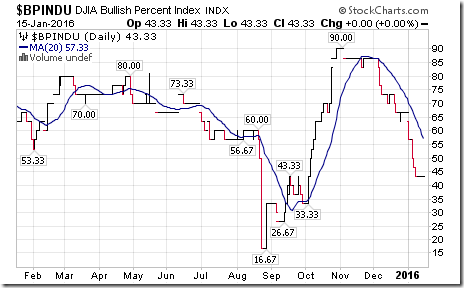
Bullish Percent Index for Dow Jones Industrial Average was unchanged last week at 43.33% and remained below its 20 day moving average.
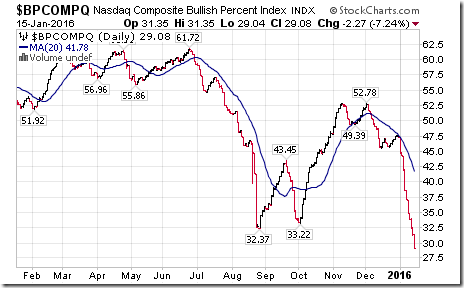
Bullish Percent Index for NASDAQ Composite stocks dropped last week to 29.08% from 37.05% and remained below its 20 day moving average. The Index remains intermediate oversold, but has yet to show signs of bottoming.
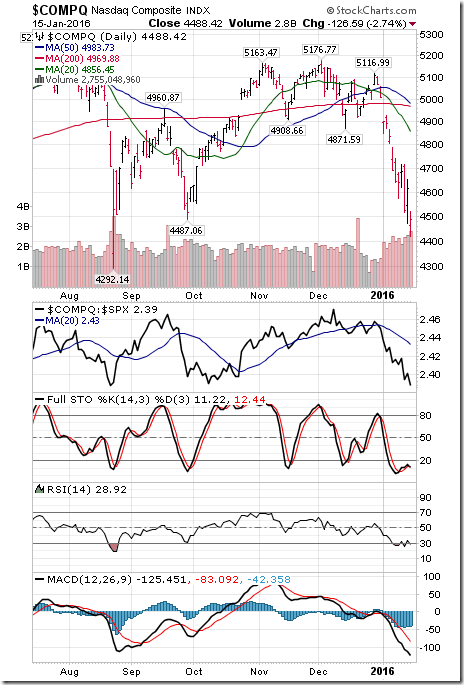
The NASDAQ Composite Index plunged 155.21 points (3.34%) last week. Intermediate trend remains down. Strength relative to the S&P 500 Index remains negative. The Index remains below its 20 day moving average. Short term momentum indicators are trending down and are oversold, but have yet to show signs of bottoming. Technical score remains at -6.
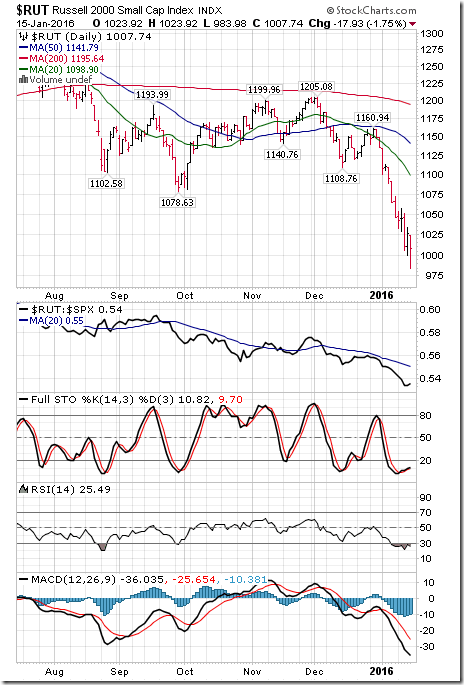
The Russell 2000 Index dropped 38.46 points (3.68%) last week. Intermediate trend remains down. Strength relative to the S&P 500 Index remains negative. The Index remains below its 20 day moving average. Short term momentum indicators are trending down and are oversold, but have yet to show signs of bottoming.
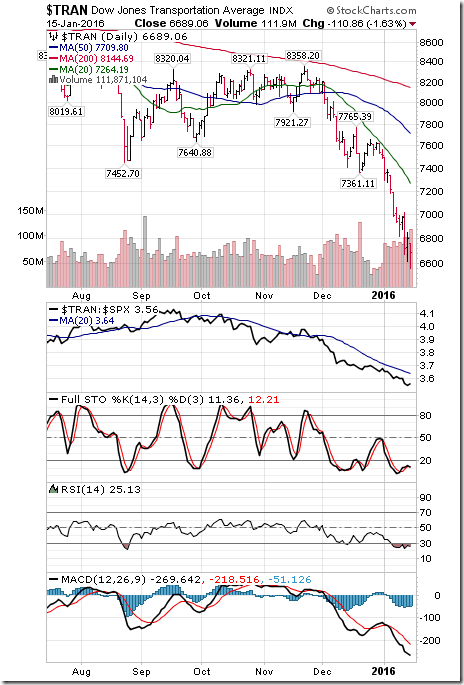
The Dow Jones Transportation Average plunged another 257.30 points (3.70%) last week. Intermediate trend remains down. Strength relative to the S&P 500 Index remains negative. The Average remains below its 20 day moving average. Short term momentum indicators are trending down and are oversold, but have yet to show signs of bottoming. Technical score remained last week at -6.
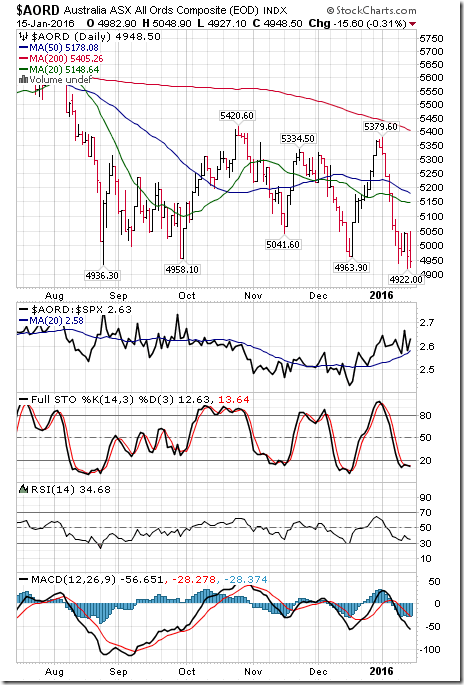
The Australia All Ordinaries Composite Index dropped 100.90 points (2.00%) last week. Intermediate trend changed to down from neutral on a move below 4,963.90. The Index remains below its 20 day moving average. Short term momentum indicators are trending down and are oversold, but have yet to show signs of bottoming. Technical score slipped last week to -2 from 0.
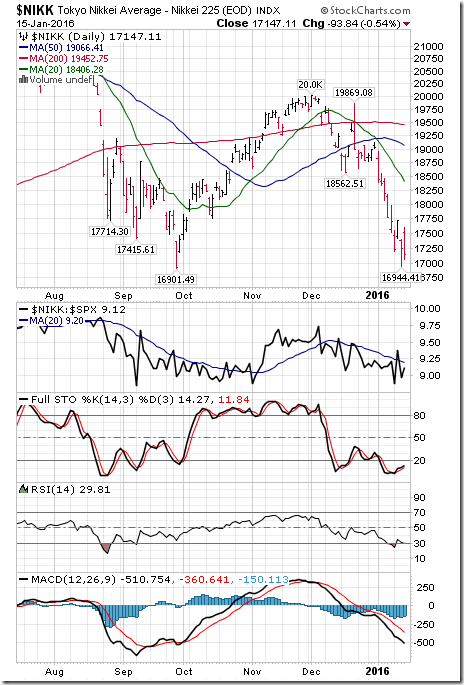
The Nikkei Average dropped 550.85 points (3.13%) last week. Intermediate trend remains neutral. Strength relative to the S&P 500 Index improved to neutral from negative. The Average remains below its 20 day moving average. Short term momentum indicators are trending down and are oversold, but have yet to show signs of bottoming. Technical score improved last week to -2 from -4.
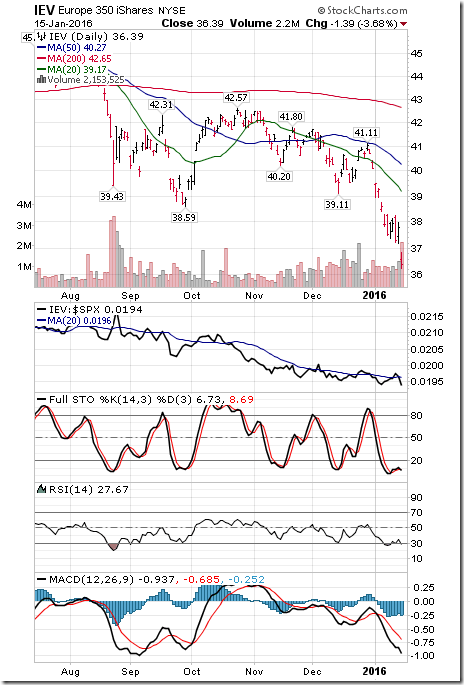
Europe 350 iShares dropped $1.06 (3.59%) last week. Intermediate trend remains down. Strength relative to the S&P 500 Index remained negative. Units remain below their 20 day moving average. Short term momentum indicators are trending down and are oversold, but have yet to show signs of bottoming. Technical score remained last week at -6
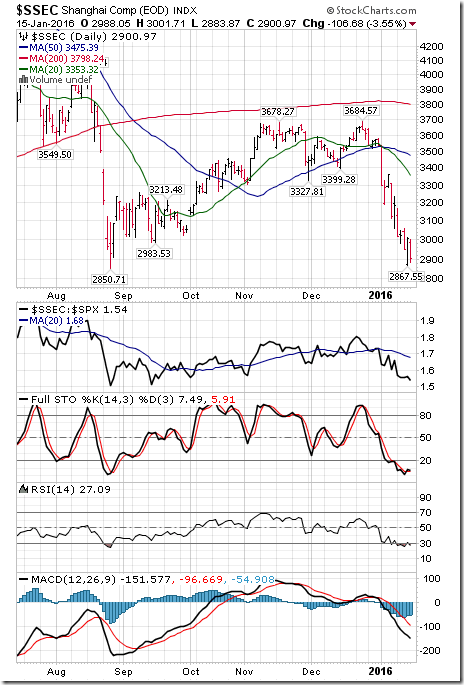
The Shanghai Composite Index plunged 285.14 points (8.95%) last week. Intermediate trend changed to down from neutral on a move below 2.983.53. Strength relative to the S&P 500 Index remains negative. The Index remains below its 20 day moving average. Short term momentum indicators are trending down and are oversold, but have yet to show signs of bottoming. Technical score dropped to -6 from -4.
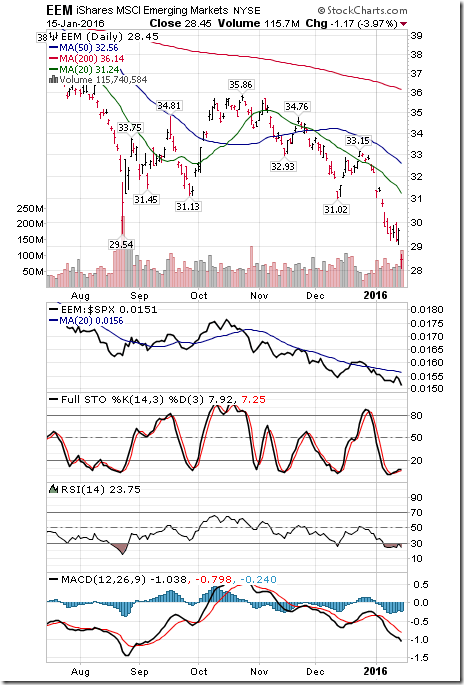
Emerging Market iShares plunged $1.06 (3.59%) last week. Intermediate trend remains down. Strength relative to the S&P 500 Index remains negative. Units remain below their 20 day moving average. Short term momentum indicators are trending down and are oversold, but have yet to show signs of bottoming. Technical score remained at -6.
Currencies
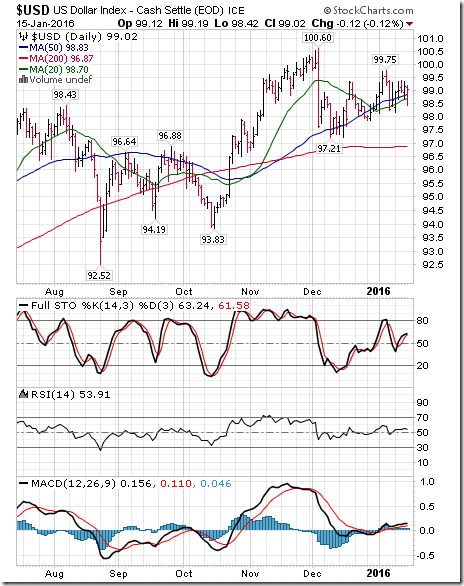
The U.S. Dollar Index added 0.50 (0.51%) last week. Intermediate trend remains up. The Index remains above its 20 day moving average. Short term momentum indicators are mixed. Evidence of an intermediate peak at the beginning of December continues to build.
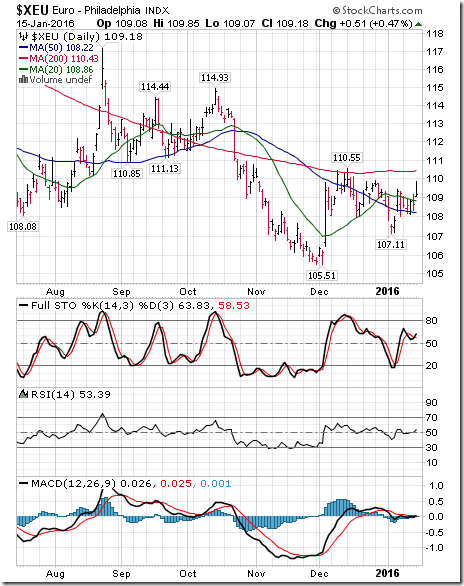
The Euro slipped 0.02 (0.02%) last week. Intermediate trend remains down. The Euro remains above its 20 day moving average. Short term momentum indicators are trending up.
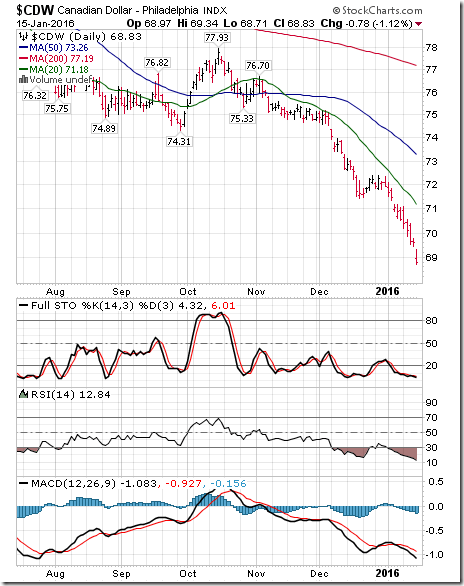
The Canadian Dollar fell another US 1.83 cents (2.59%) last week. Intermediate trend remains down. The Canuck Buck remains below its 20 day moving average. Short term momentum indicators are trending down and are overbought, but have yet to show signs of bottoming.
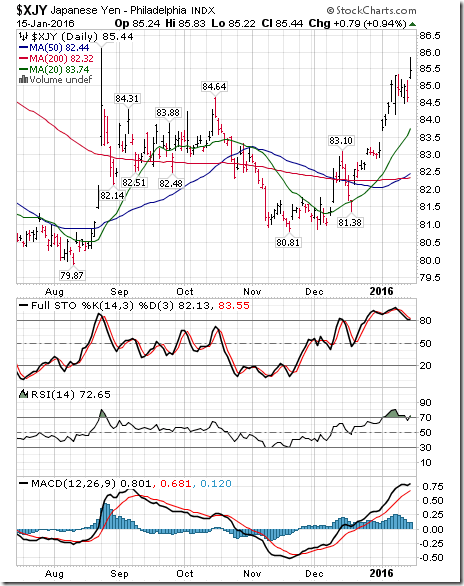
The Japanese Yen gained 0.38 (0.45%) last week. Intermediate trend remains neutral. The Yen remains above its 20 day moving average. Short term momentum indicators are trending up and are overbought.
Commodities
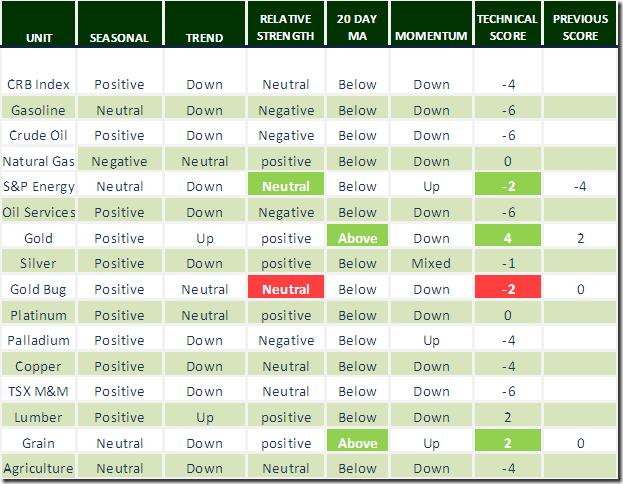
Daily Seasonal/Technical Commodities Trends for January 14th 2016
Green: Increase from previous day
Red: Decrease from previous day
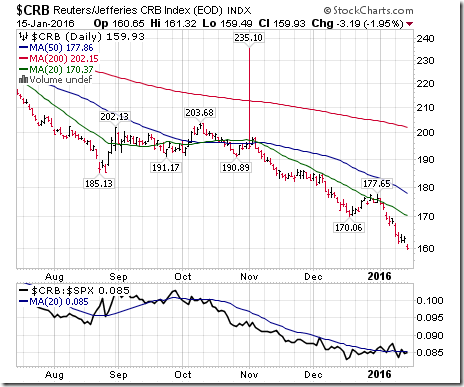
The CRB Index dropped 8.65 points (5.13%) last week. Intermediate trend remains down. Strength relative to the S&P 500 Index changed to neutral from positive. The Index remains below its 20 day moving average. Short term momentum indicators are trending down and are oversold, but have yet to show signs of bottoming. Technical score slipped last week to -4 from -2
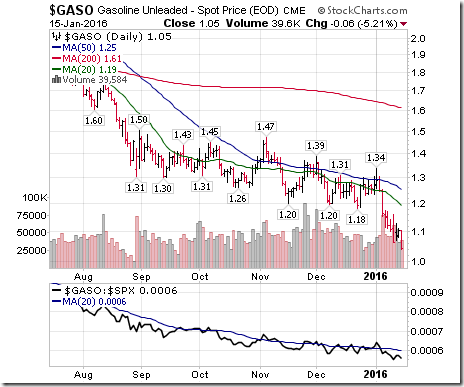
Gasoline dropped $0.08 per gallon (7.08%) last week. Intermediate trend remains down. Strength relative to the S&P 500 Index changed last week to negative from neutral. Gas remains below its 20 day moving average. Short term momentum indicators are trending down. Technical score dropped last week to -6 from -4.
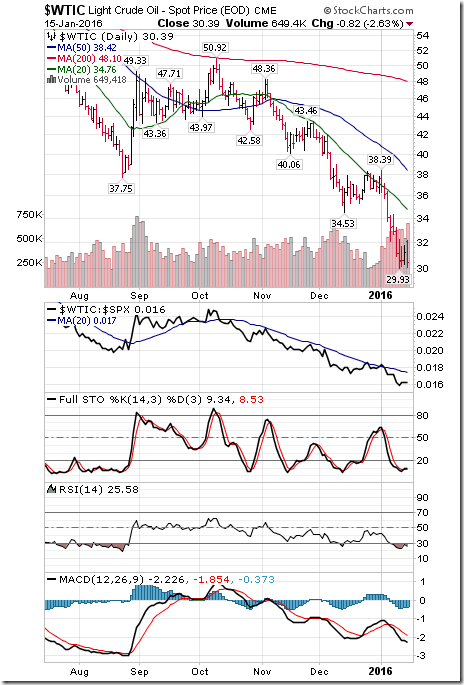
Crude Oil dropped $2.77 per barrel (8.35%) last week. Intermediate trend remains down. Strength relative to the S&P 500 Index remains negative. Crude remains below its 20 day moving average. Short term momentum indicators are trending down and are oversold, but have yet to show signs of bottoming. Technical score remained at -6.
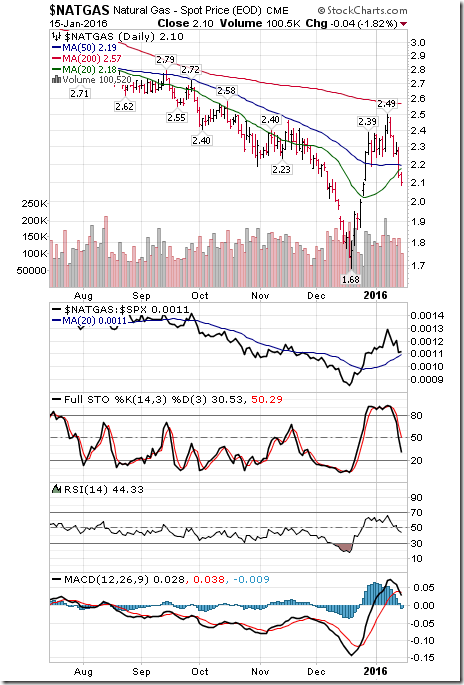
Natural Gas fell $0.37 per MBtu (14.98%) last week. Intermediate trend remains neutral. Strength relative to the S&P 500 Index remains positive. “Natty” fell below its 20 day moving average. Short term momentum indicators are trending down. Technical score dropped last week to 0 from 4
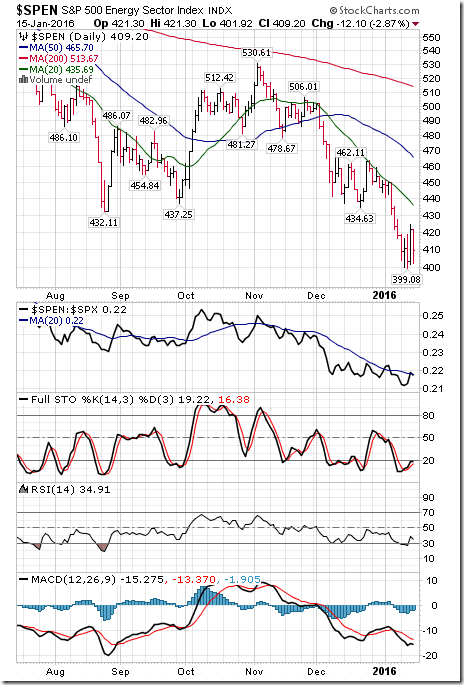
The S&P Energy Index dropped 8.57 points (2.05%) last week. Intermediate trend remains down. Strength relative to the S&P 500 Index remains neutral. The Index remains below its 20 day moving average. Short term momentum indicators are trending up. Technical score improved last week to -2 from -4.
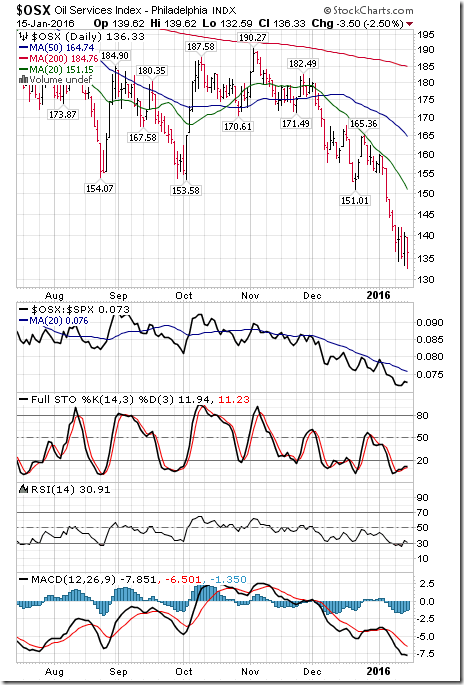
The Philadelphia Oil Services Index dropped 5.87 points (4.13%) last week. Intermediate trend remains down. Strength relative to the S&P 500 Index remains negative. The Index remains below its 20 day moving average. Short term momentum indicators are trending down and are oversold, but have yet to show signs of bottoming. Technical score remains at -6.
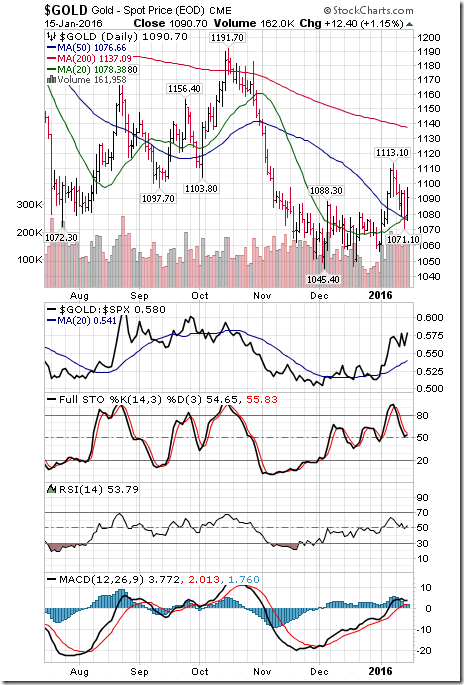
Gold slipped $7.20 per ounce (0.66%) last week. Intermediate trend remains up. Strength relative to the S&P 500 Index remains positive. Gold recovered back above its 20 day moving average. Short term momentum indicators are trending down. Technical score slipped last week to 4 from 6.
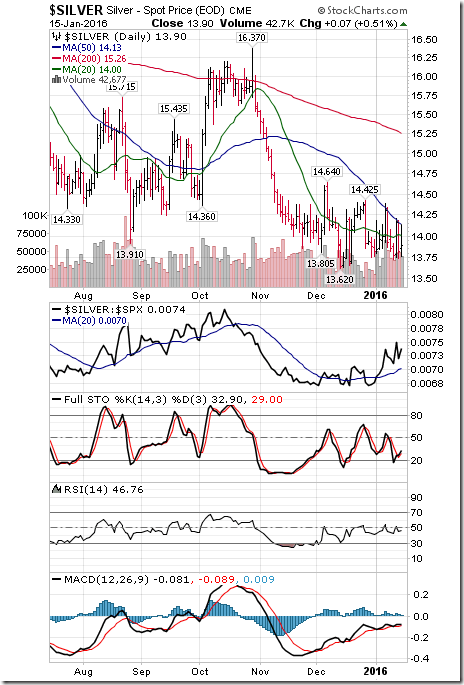
Silver slipped $0.02 per ounce (0.14%) last week. Intermediate trend remains down. Strength relative to the S&P 500 Index remains positive. The Index remains below its 20 day moving average. Short term momentum indicators are mixed. Technical score slipped last week to -1 from 0. Strength relative to Gold remains negative.
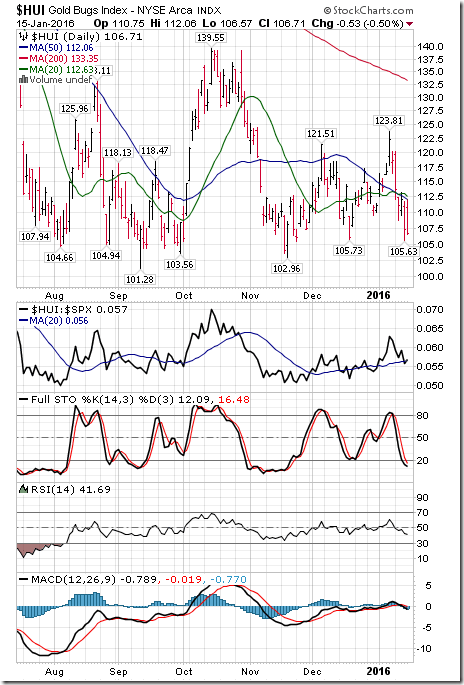
The Gold Bug Index dropped 11.83 points (10.00%) last week. Intermediate trend changed to neutral from up on a move below 105.73. Strength relative to the S&P 500 Index changed to neutral from positive. The Index fell below its 20 day moving average. Short term momentum indicators are trending down. Technical score dropped to -2 from 6.
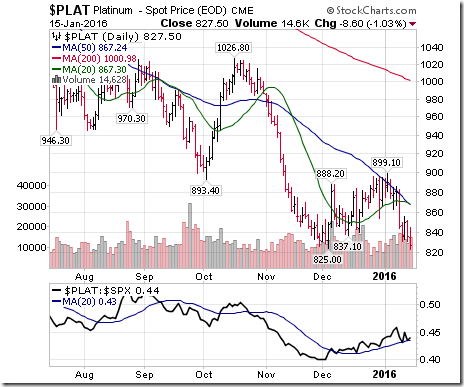
Platinum dropped $51.20 per ounce (5.83%) last week. Trend changed to down from up on a move below $825.00. Fell below its 20 day moving average. Momentum turned down.
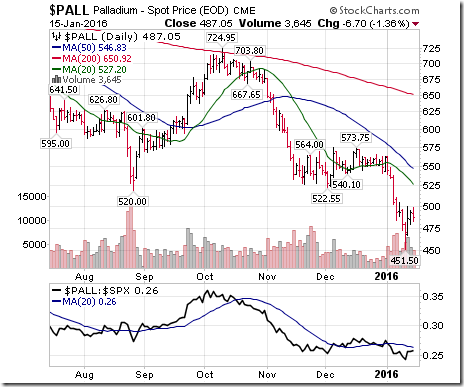
Palladium dropped $6.55 per ounce (1.33%) last week. Intermediate trend remains down. Strength relative to the S&P 500 Index remains negative. PALL remains below its 20 day moving average. Short term momentum indicators are trending up. Technical score: -4.
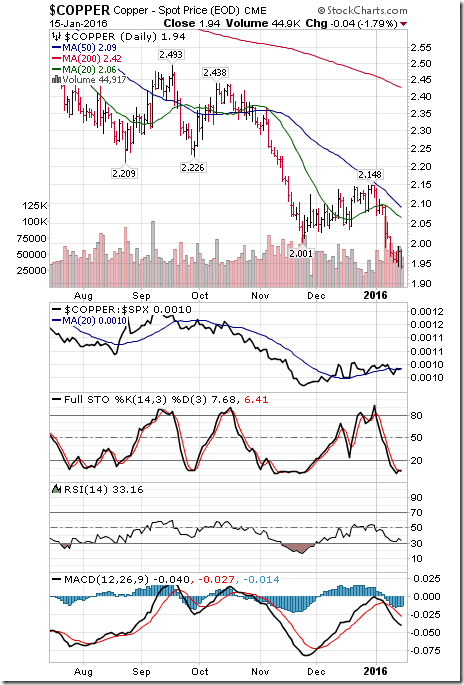
Copper dropped $0.08 per lb. (3.97%) last week. Intermediate trend remains down. Strength relative to the S&P 500 Index changed to neutral from positive. Copper remains below its 20 day moving average. Short term momentum indicators are trending down. Technical score dipped last week to -4 from -2
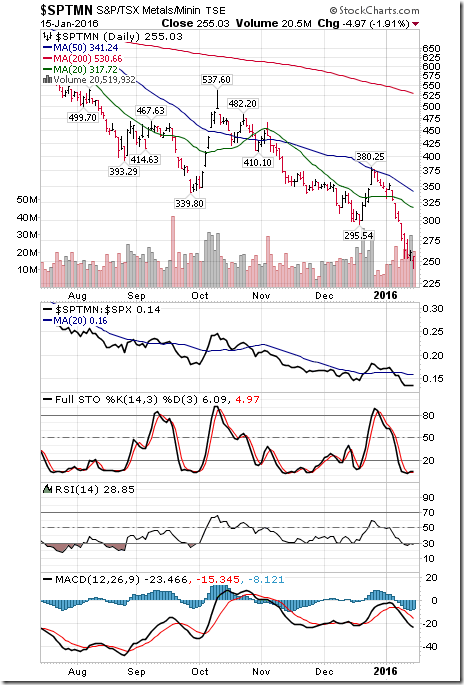
The TSX Metals & Mining Index dropped 44.63 points (14.89%) last week. Intermediate trend remains down. Strength relative to the S&P 500 Index changed to negative from neutral. The Index remains below its 20 day moving average. Short term momentum indicators are trending down. Technical score dropped to -6 from -4
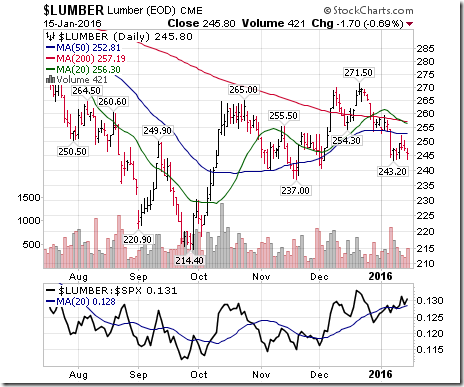
Lumber dipped $1.30 (0.53%) last week. Intermediate trend remains up. Strength relative to the S&P 500 Index turned positive. Lumber remains below its 20 day moving average.
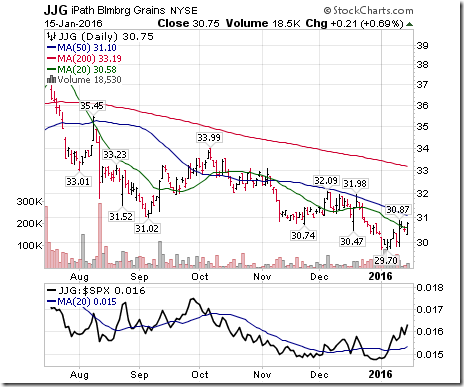
The Grain ETN added $0.34 (1.12%) last week. Intermediate trend remains down. Strength relative to the S&P 500 Index remains positive. Units moved above their 20 day moving average. Short term momentum indicators are trending up. Technical score improved to 2 from 0.
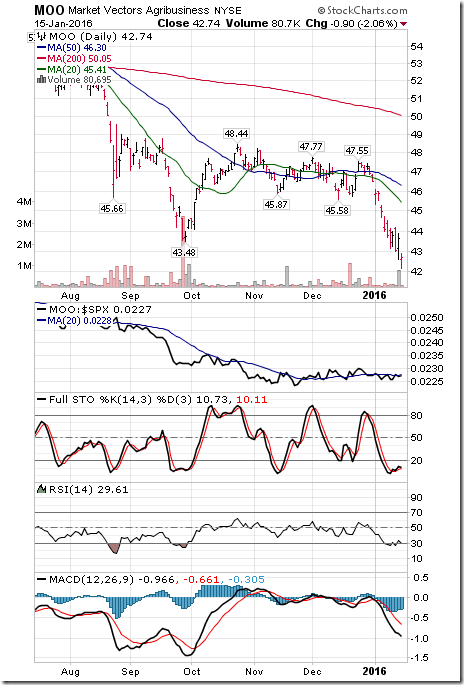
The Agriculture ETF dropped $1.04 (2.38%) last week. Intermediate trend remains down. Strength relative to the S&P 500 Index remains neutral. Units remain below their 20 day moving average. Short term momentum indicators are trending down. Technical score remains at -4.
Interest Rates
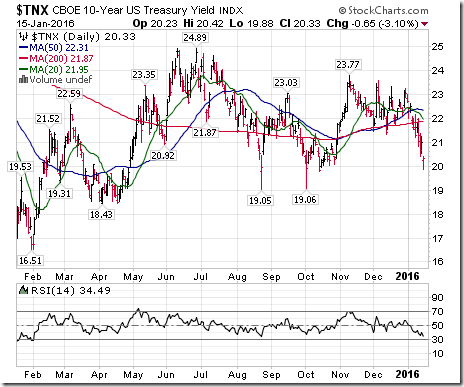
Yield on 10 year Treasuries dropped 9.7 basis points (4.55%) last week. Intermediate trend remain up. Yield remains below its 20 day moving average. Short term momentum indicators are trending down.
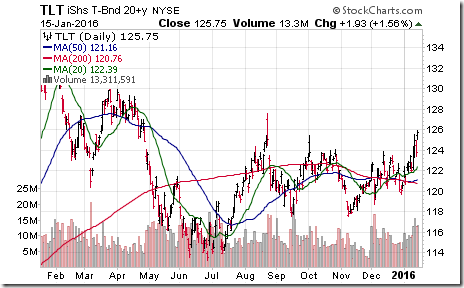
Conversely, price of the long term Treasury ETF added $2.39 (1.94%) last week. Units remain above their 20 day moving average.
Other Issues
U. S. equity markets are closed today for the Martin Luther King holiday.
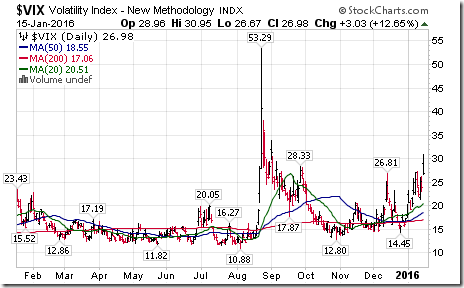
The VIX Index increased 0.73 (2.78%) but spiked to as high as 30.95% on Friday. Intermediate trend changed to up from neutral on a move above 26.81%.
Short and intermediate technical indicators are oversold for most equity indices and primary sectors, but have yet to show signs of bottoming.
China is an international focus. China’s fourth quarter GDP to be reported on Tuesday are expected to grow at a 6.9% rate.
Responses to fourth quarter results have been negative despite better than consensus earnings and revenues reported by most companies to date. 78% of reporting companies exceeded consensus earnings estimates and 47% exceeded consensus revenue estimates. Another 56 S&P 500 companies and 7 Dow Jones Industrial companies are scheduled to report this week.
According to FactSet consensus for S&P 500 companies is a year-over-year decline of 5.7% in earnings and 3.3% drop in revenues. 84 companies have issued negative guidance and 29 companies have issued positive guidance. Consensus for first quarter earnings is for a year-over-year decline of 0.6% versus a previous estimate for a gain of 0.5%. Consensus for first quarter revenues is a gain of 2.1%, down from 2.3%. Consensus for 2016 is a gain in earnings of 6.7% and an increase in revenues of 3.9%, down from 7.4% and 4.2% respectively.
Economic data released this week is expected to be slightly positive relative to previous months.
Technical action by S&P 500 stocks remains bearish. Last week, 69 S&P 500 stocks broke support and only 5 stocks (mostly utilities) broke resistance.
The El Nino effect on equity markets is expected to be positive until at least the end of February.
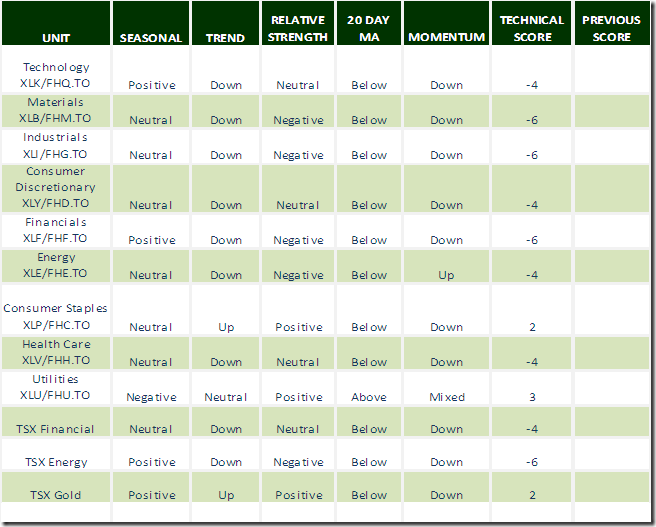
Sectors
Green: Increase from previous day
Red: Decrease from previous day
StockTwits Released on Friday
Initial Jobless Claims spike by over 45% in past two weeks as seasonal hires become unemployed.
Technical action by S&P 500 stocks to 10:00: Bearish. No breakouts. Breakouts: $IGT, $RCL $SPLS, $KO, $KHC, $DGX, $HUM.
Editor’s Note: Another 5 S&P 500 stocks broke support after 10:00 AM: CAG, HCA, NLSN, TMO, TWC.
Special Free Services available through www.equityclock.com
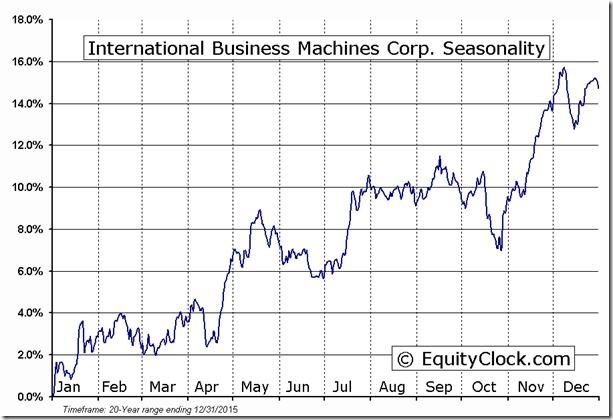
Equityclock.com is offering free access to a data base showing seasonal studies on individual stocks and sectors. The data base holds seasonality studies on over 1000 big and moderate cap securities and indices. To login, simply go to http://www.equityclock.com/charts/ Following is an example:
Disclaimer: Seasonality and technical ratings offered in this report by www.timingthemarket.ca and www.equityclock.com are for information only. They should not be considered as advice to purchase or to sell mentioned securities. Data offered in this report is believed to be accurate, but is not guaranteed.
Copyright © DV Tech Talk, Timingthemarket.ca


