Probably Everything You Need To Know About Bear Markets
by Michael Batnick, The Irrelevant Investor
10%= correction, 20%= bear market.
I know these arbitrary numbers sometimes seem silly, but when looking at the data, you have to draw the line somewhere. Get over it, let’s move on.
The S&P 500 has been in a drawdown for the last eight months. Stocks are currently 9.2% below the highs made in May 2015, just a hair away from official correction territory. Everyone knows this is totally normal, but you might be surprised to know that since 1928, stocks have been in a 10% drawdown 55% of the time. The problem of course is that they never feel normal because we don’t know in real time if this is just a correction or the start of a bear market. And the deeper stocks go, the harder it is to resist fear’s temptation.
In times like this, historical facts don’t provide much comfort and even less of a roadmap, however, hopefully they can provide a little context.
Since 1928, there have been fifteen separate drawdowns of 10%. Before I continue, you might be thinking, “only fifteen corrections, that doesn’t sound right.” Here’s how I look at drawdowns; in my mind, a drawdown is not over until new highs are made. Of these fifteen corrections, ten have turned into a bear market.
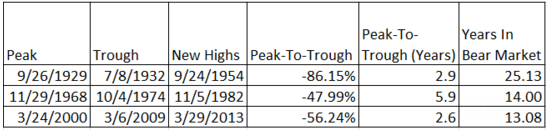
Let’s take a closer examination of these 20% declines because not all bear markets are created equal. There are secular bear markets, which by their nature can only be defined after the fact. These are long periods of time in which stocks make little progress. Then there are cyclical bears, which can come in the middle of a long secular bear or even a secular bull. The chart below shows the three secular bears over the last ninety years.
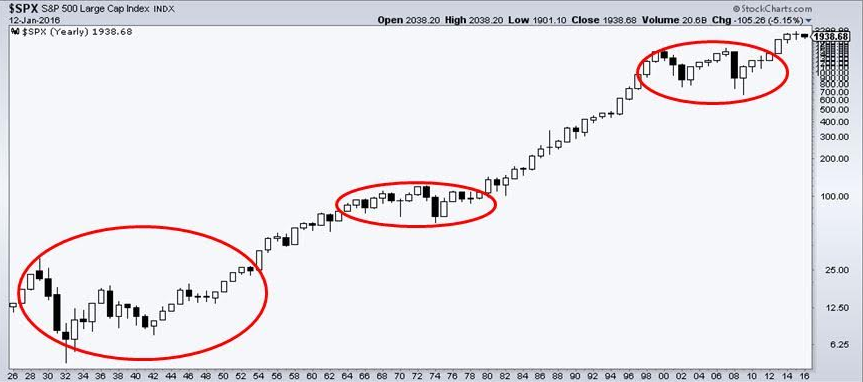
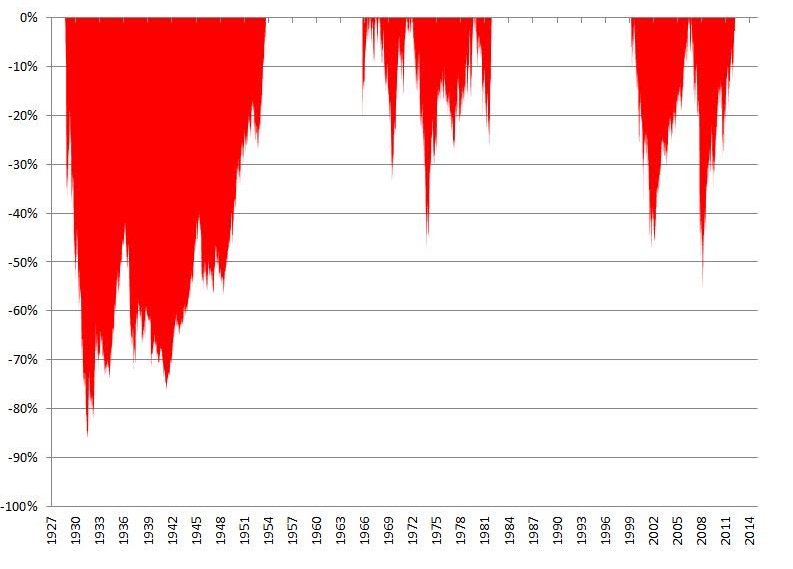
As you can see, the defining characteristic for secular bears is that stocks make no progress for long periods of time. Even worse, they experience severe declines which can scar an entire generation of investors. The chart below shows the painful drawdowns investors witness during these secular bear markets.
The frustrating thing about each and every bear is it’s impossible to know how long they will last. Think about the most recent secular bear, which lasted from March 2000 through March 2013 (I think it’s over, though reasonable people can disagree on this). Stocks briefly poked their heads above their 2000 highs in October 2007 before being slammed right back into their decade long range. Investors had a similar experience in 1980; break above the long range for a minute only to be delivered one final gut punch.
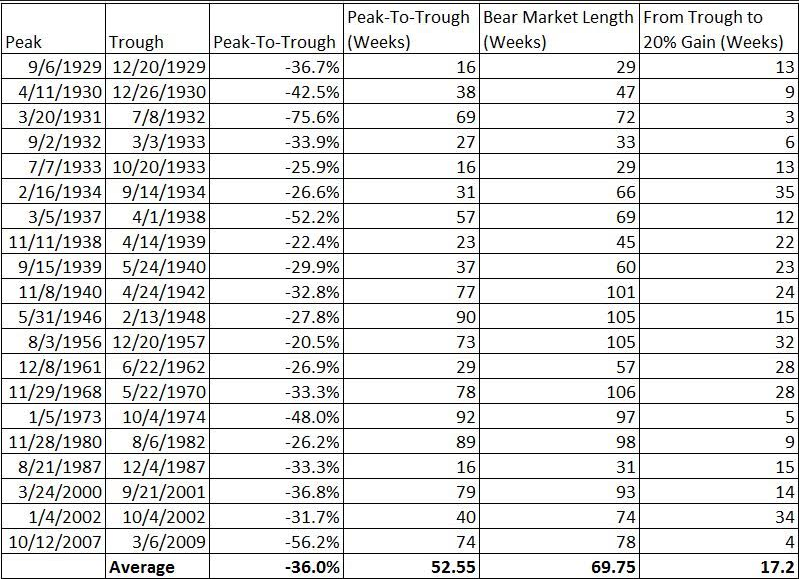
Looking at bear markets over long periods of time might not be as helpful as breaking them down further. Within the three secular bears have been distinct cyclical bears (think the tech bubble of 2000 and credit bubble of 2007). Here is how I’ve compiled the data below; any time there is a 20% rally, the bear market is over. What this does is break up 1929-1954 period into 11 separate bear markets.
The average of these 20 distinct bear markets saw a 36% peak-to-trough decline, lasting just over 52 weeks. The fifth column shows how long each bear was and the the sixth column shows how quickly stocks gained 20% from their lows, resetting the bear market. For instance, the October ’07 peak to the March ’09 lows was 74 weeks. Stocks then rallied 20% in 4 weeks, making 78 weeks the total length of that particular bear market.
Whether the S&P 500 sees a correction, and whether or not that turns into a bear market, and how deep it might go and how long it might last is anybody’s guess. The only thing in your control is what you choose to do or not do. Making decisions in the heat of the moment is almost never a good idea, which is why having a plan in place is so important. Knowing that you have an answer, whether stocks go up, down or sideways a is really liberating feeling.
Copyright © The Irrelevant Investor
This post was originally published at The Irrelevant Investor.