by Don Vialoux, Timingthemarket.ca
Jon Vialoux on BNN’s Market Call Tonight
Jon is on the show this evening at 6:00 PM EST
StockTwits Released Yesterday @EquityClock
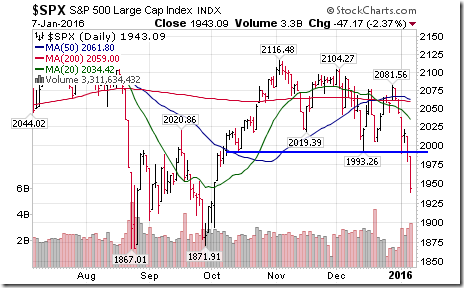
Cracks emerge on the S&P 500 Index as support is broken.
Technical action by S&P 500 stocks to 10:30 AM: Bearish. 64 stocks broke support. None broke resistance.
Editor’s Note: After 10:30 AM, another 24 S&P 500 stocks broke support. None broke resistance.
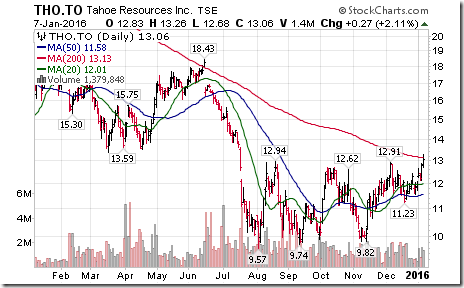
Tahoe Resources $THO.CA, a silver producer has joined the list of gold stocks breaking resistance.
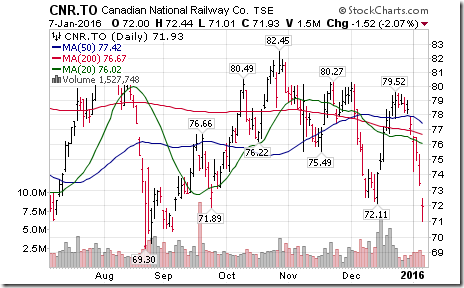
Canadian National Railway broke support at $72.11 to extend its downtrend. $CNR.CA
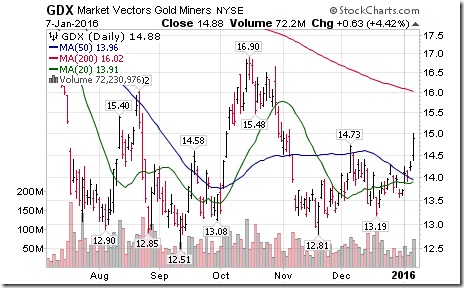
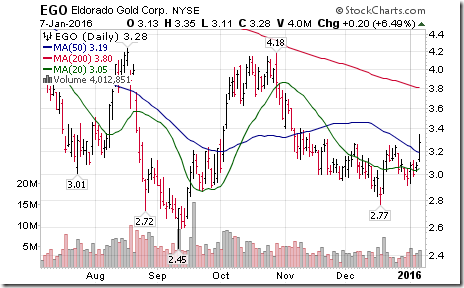
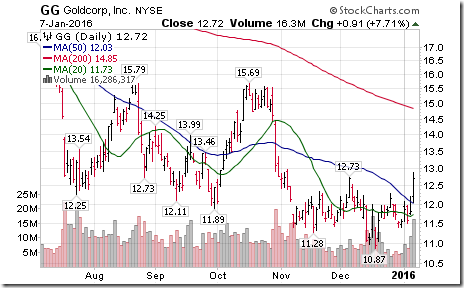
More gold equities and ETFs breaking resistance and completing a base building pattern: $GDX, $EGO, $GG
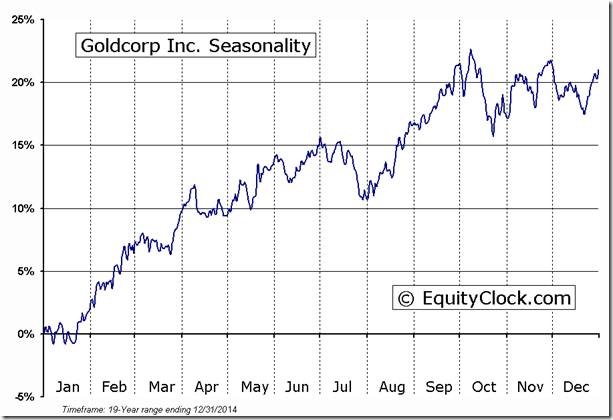
‘Tis the season to own Goldcorp until at least early March! G.CA GG
Put- Call Ratio ends overly bearish at 1.39, a level that is typically conducive to short term lows in stocks.
Trader’s Corner
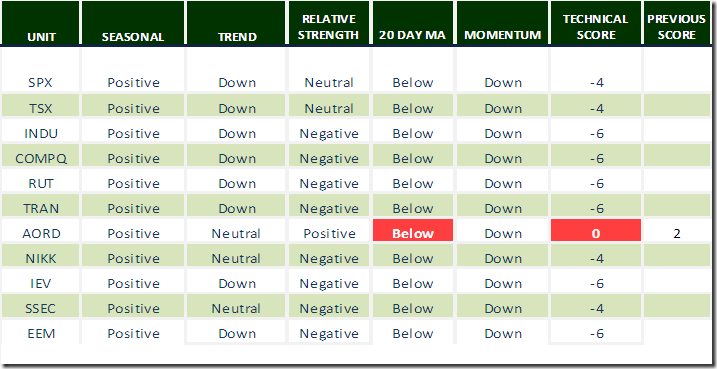
Daily Seasonal/Technical Equity Trends for January 7th 2016
Green: Increase from previous day
Red: Decrease from previous day
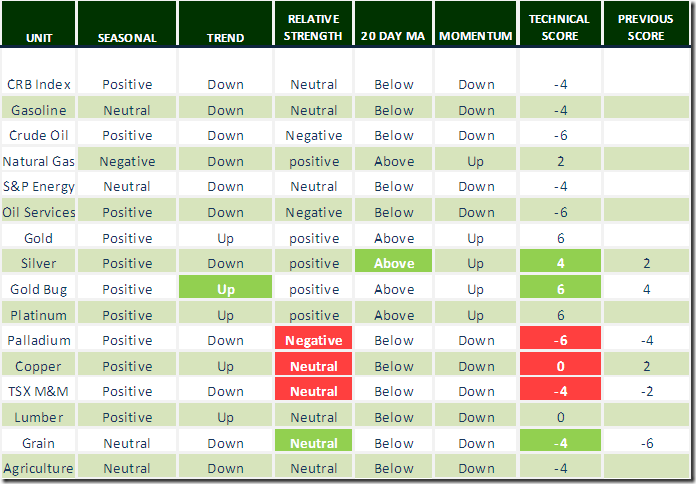
Daily Seasonal/Technical Commodities Trends for January 7th 2016
Green: Increase from previous day
Red: Decrease from previous day
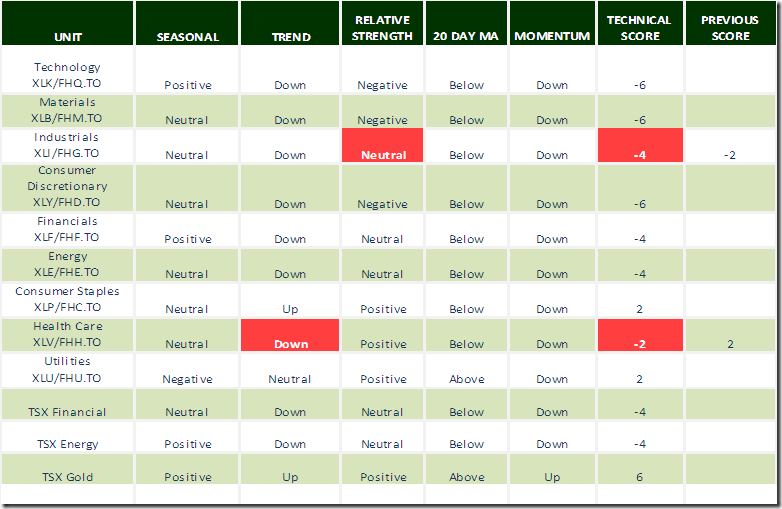
Daily Seasonal/Technical Sector Trends for January 7th 2016
Green: Increase from previous day
Red: Decrease from previous day
Interesting Charts
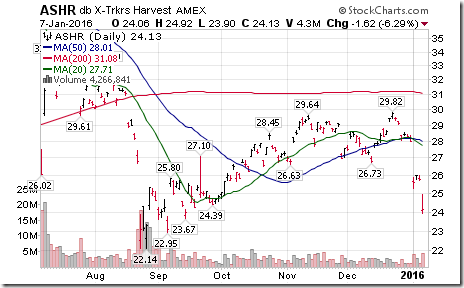
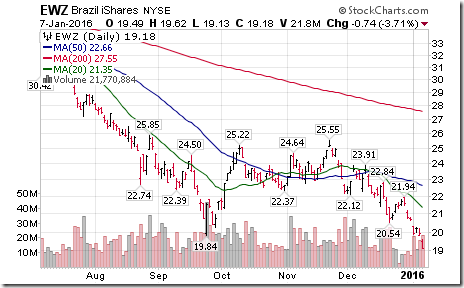
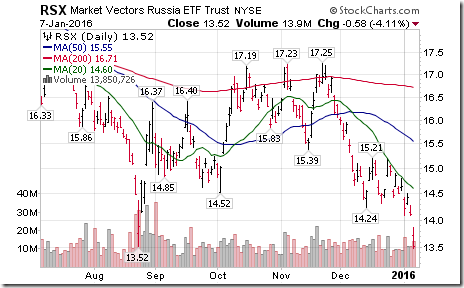
A collapse by the Chinese A shares triggered a sharp decline in world equity markets.
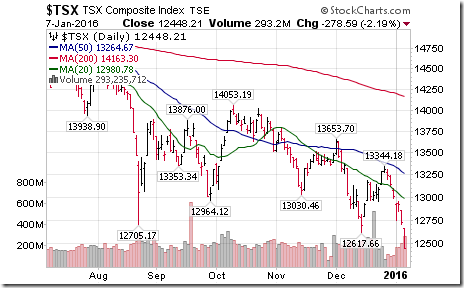
The TSX Composite Index broke support at 12,617.66 to reach at 29 month low.
Other energy sensitive equity indices and their related ETFs also were hit.
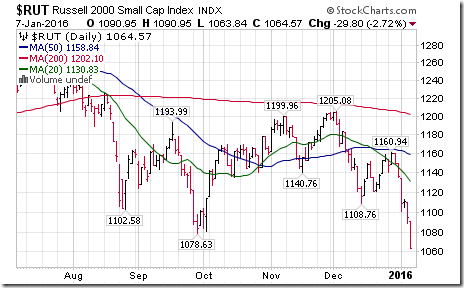
The Russell 2000 Index broke support at 1,078.63 to reach a 16 month low.
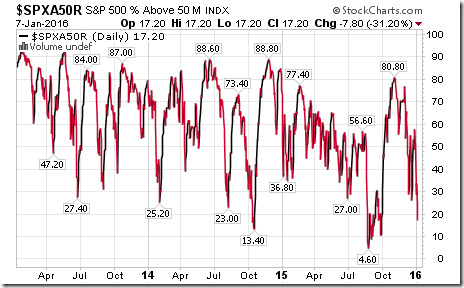
Percent of S&P 500 stocks trading above their 50 day moving average is deeply oversold at 17.20%, but has yet to show signs of bottoming
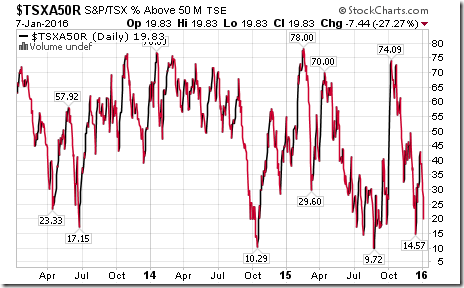
Ditto for Percent of TSX Composite stocks trading above their 50 day moving average!
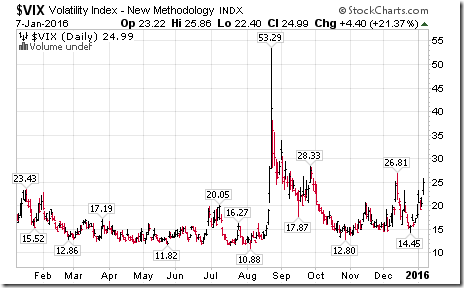
The VIX Index spiked.
Special Free Services available through www.equityclock.com
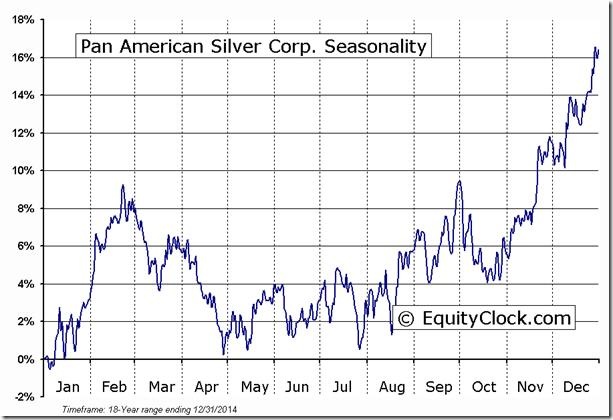
Equityclock.com is offering free access to a data base showing seasonal studies on individual stocks and sectors. The data base holds seasonality studies on over 1000 big and moderate cap securities and indices. To login, simply go to http://www.equityclock.com/charts/ Following is an example:
Disclaimer: Seasonality and technical ratings offered in this report by www.timingthemarket.ca and www.equityclock.com are for information only. They should not be considered as advice to purchase or to sell mentioned securities. Data offered in this report is believed to be accurate, but is not guaranteed.
Copyright © DV Tech Talk, Timingthemarket.ca


