by Don Vialoux, Timingthemarket.ca
Pre-opening Comments for Wednesday December 2nd
U.S. equity index futures were mixed this morning. S&P 500 futures were unchanged in pre-opening trade.
Index futures were virtually unchanged following release of economic news. Consensus for November ADP Private Payrolls was an increase to 185,000 from 182,000 in October. Actual was 217,000. Consensus for second estimate of third quarter Productivity was 2.2% versus the previous estimate of 1.6%. Actual was 2.2%.
Royal Bank added $0.41 to US $58.00 after reporting higher than consensus fourth quarter earnings.
Bristol Myers added $0.45 to $68.71 after Guggenheim Securities upgraded the stock to buy.
Chevron gained $0.07 to $92.55 after Citigroup upgraded the stock to buy. Target is $110
Nike slipped $1.11 to $132.20 after Goldman Sachs downgraded the stock to buy from conviction buy. Target is $148
EquityClock’s Daily Market Comment
Following is a link:
http://www.equityclock.com/2015/12/01/stock-market-outlook-for-december-2-2015/
Note seasonality charts on U.S. Construction Spending
StockTwits Released Yesterday
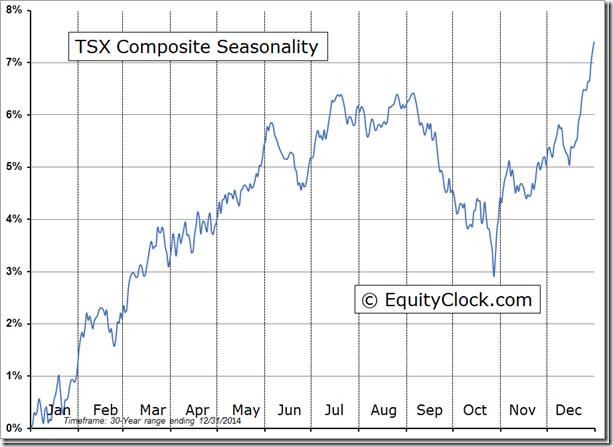
Returns for Canadian equity market in December tends to top that of American counterparts
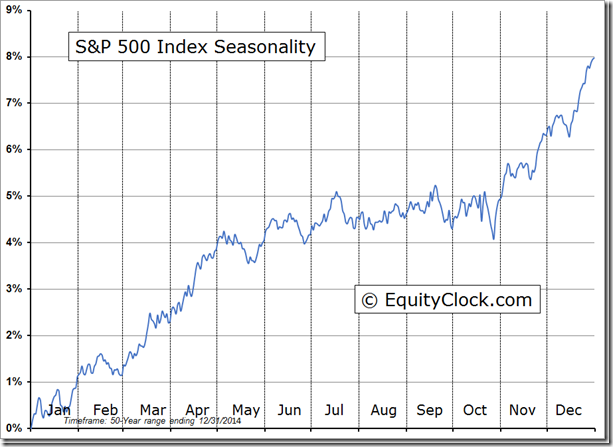
December typically strong for stocks with S&P 500 gaining 72% of periods returning an average of 1.5%.
Technical action by S&P 500 stocks to 2.30: Bullish. 16 stocks broke intermediate resistance. 5 broke support.
Editor’s Note: After 2:30 PM EST, another 5 S&P 500 stocks broke intermediate resistance: DHI, HAL, PBCT, HCA and LH.
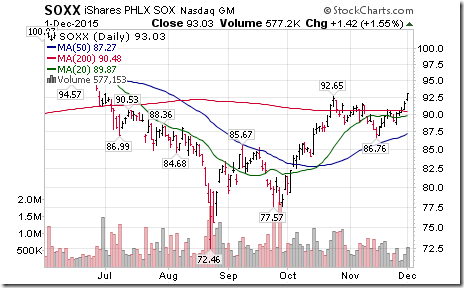
Nice breakout by semiconductor ETFs $SOXX $SMH above resistance to extend an intermediate uptrend!
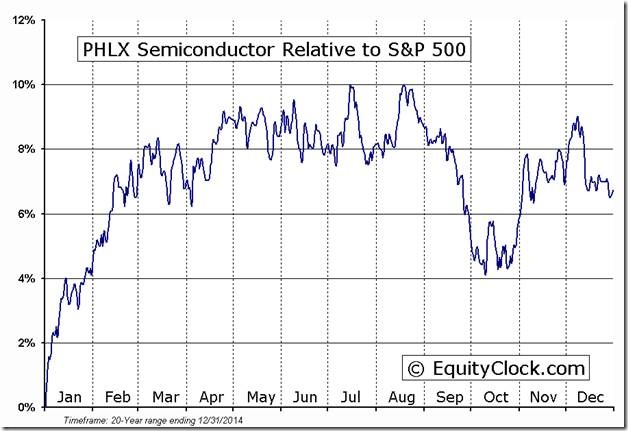
‘Tis the season on a real and relative basis for the semiconductor to move higher until early March!
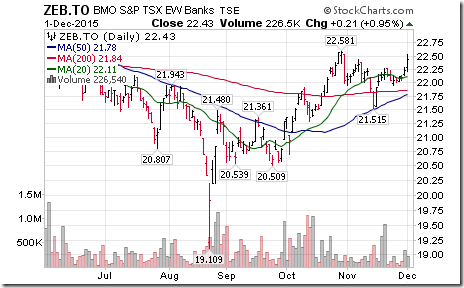
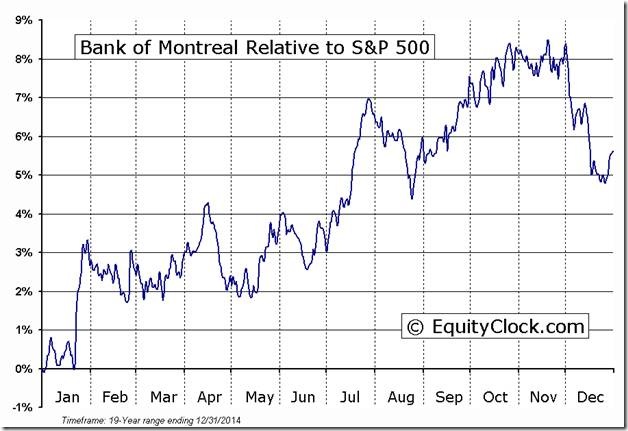
Positive response by Cdn. banks following better than expected Q4 EPS by $BNS and $BMO. Breakouts: TD, NA
Reminder that Cdn. banks tend to come under profit taking pressures a few days after strong Q4 results are released
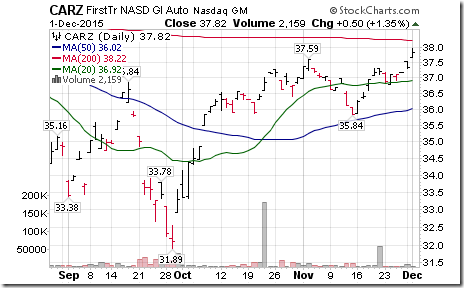
Nice breakout by $CARZ to extend an uptrend following record 18.2 million U.S. car sales in November
Interesting Charts
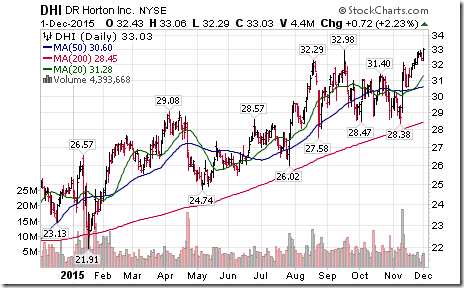
Home builder stocks such as DR Horton were leaders on the upside again yesterday. Nice breakout to a 9 year high!
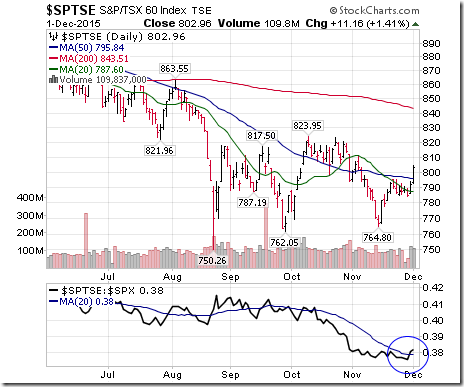
The period of outperformance by the TSX Composite Index and TSX 60 Index until early March has started.
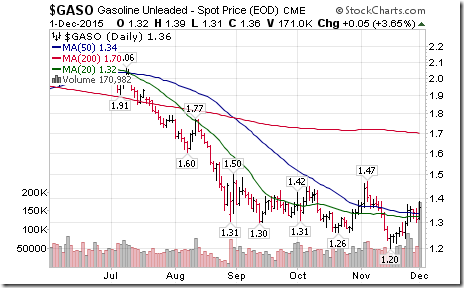
Commodity prices continue to recover, led yesterday by gasoline prices. Wholesale gasoline prices have increased 13.3% from their lows set two weeks ago.
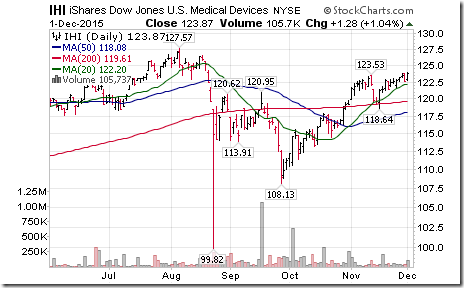
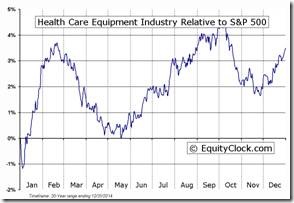
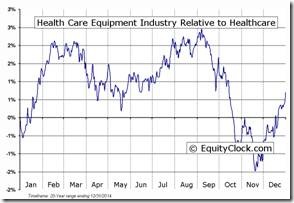
Nice breakout by the Healthcare Equipment ETF to extend an intermediate uptrend!
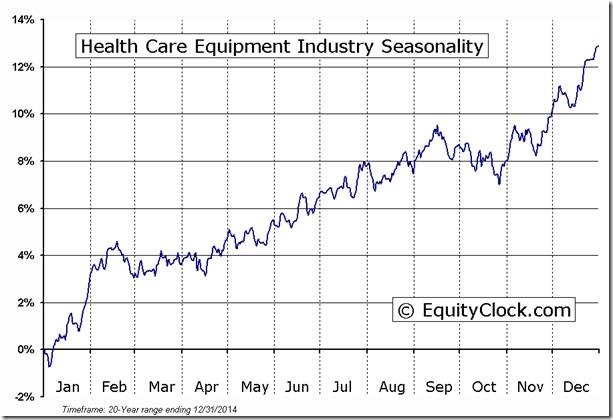
‘Tis the season for the sector to move higher on a real and relative basis!
FP Trading Desk Headline
FP Trading Desk headline reads, “Why Canadian stocks may outperform in 2016”. Following is a link:
http://business.financialpost.com/investing/trading-desk/why-canadian-stocks-may-outperform-in-2016
Trader’s Corner
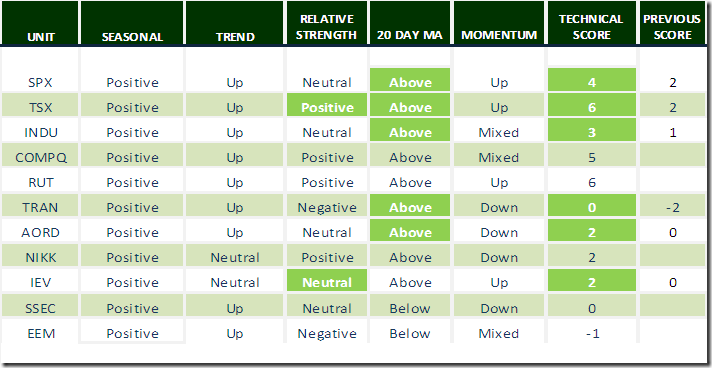
Editor’s Note: Most of the gains in technical score yesterday were triggered by moves by investments above their 20 day moving average.
Daily Seasonal/Technical Equity Trends for December 1st 2015
Green: Increase from previous day
Red: Decrease from previous day
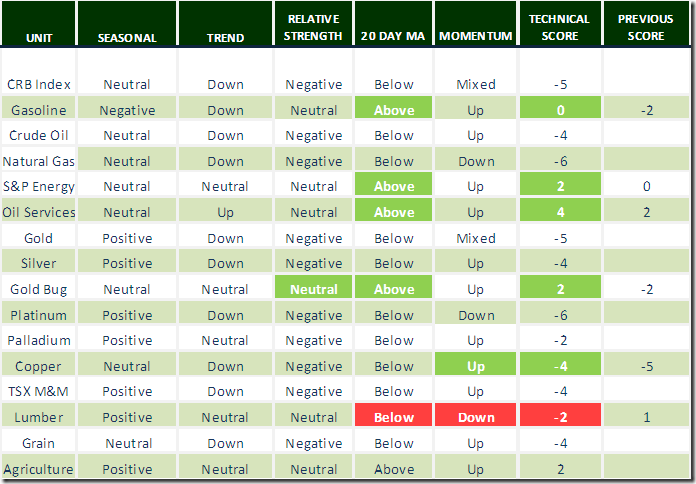
Daily Seasonal/Technical Commodities Trends for December 2nd 2015
Green: Increase from previous day
Red: Decrease from previous day
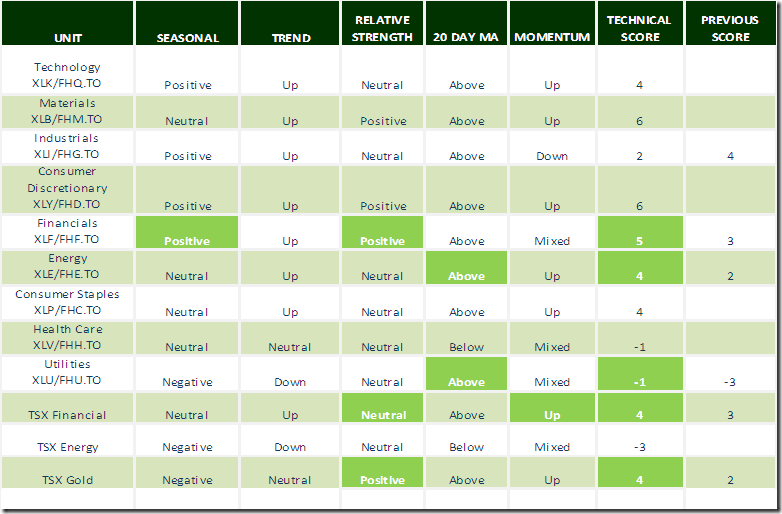
Daily Seasonal/Technical Sector Trends for December 1st 2015
Green: Increase from previous day
Red: Decrease from previous day
Special Free Services available through www.equityclock.com
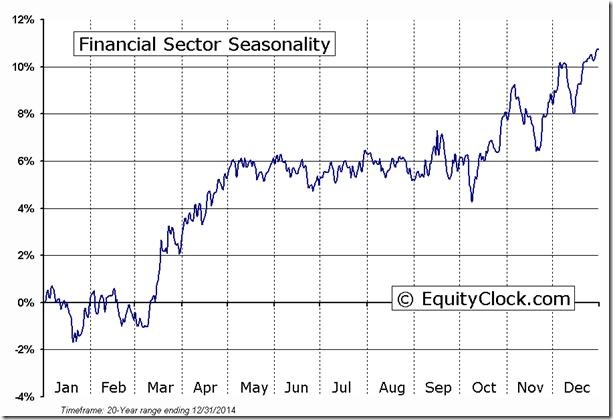
Equityclock.com is offering free access to a data base showing seasonal studies on individual stocks and sectors. The data base holds seasonality studies on over 1000 big and moderate cap securities and indices. To login, simply go to http://www.equityclock.com/charts/
Following is an example:
Disclaimer: Seasonality and technical ratings offered in this report by www.timingthemarket.ca and www.equityclock.com are for information only. They should not be considered as advice to purchase or to sell mentioned securities. Data offered in this report is believed to be accurate, but is not guaranteed.
Copyright © DV Tech Talk, Timingthemarket.ca


