by Don Vialoux, Timingthemarket.ca
Editor’s Note: Don Vialoux is on BNN’s Market Call Today at 1:00 PM EST
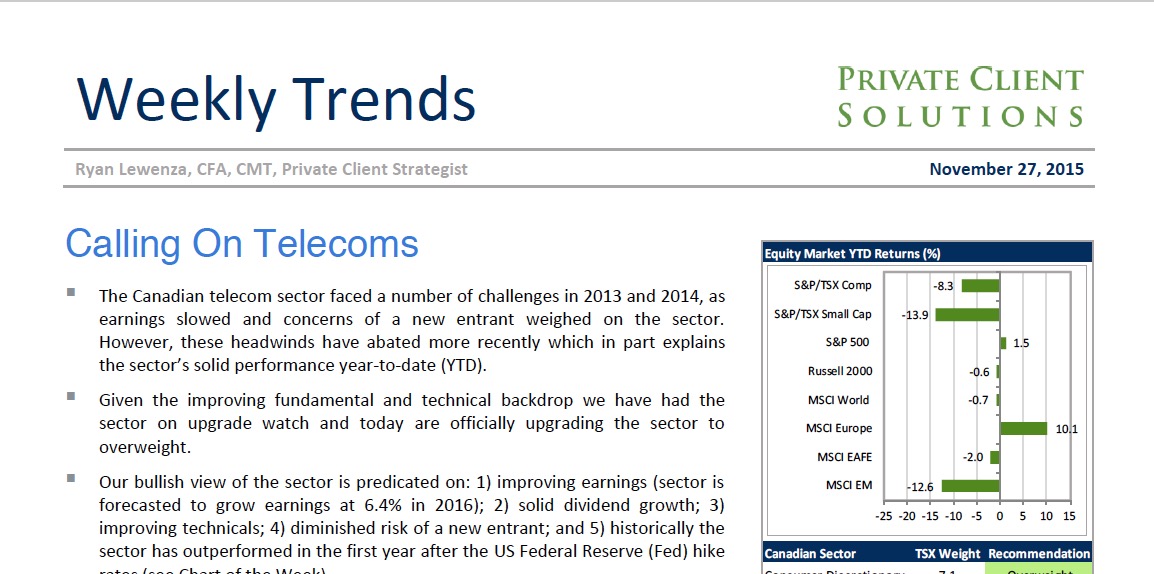
Pre-opening Comments for Monday November 30th
U.S. equity index futures were higher this morning. S&P 500 futures were up 4 points in pre-opening trade.
American Eagle Outfitter slipped $0.17 to $16.23 after Oppenheimer downgraded the stock to perform from outperform. Target is $17.
Fitbit added $1.08 to $28.92 after Barclays upgraded the stock to Overweight from Equal Weight. Target is $49.
Lululemon dropped $2.35 to $50.25 after FBR Capital downgraded the stock to Under Perform.
Microsoft added $0.70 to $54.63 after Raymond James upgraded the stock to Strong Buy. Target is $62.
Oppenheimer upgraded the oil services sector. Stocks receiving an upgrade included National Oil Well Varco, Nabors Industries, Noble Corp, Oceaneering International and Pacific Drilling.
EquityClock’s Daily Market Comment
Following is a link:
http://www.equityclock.com/2015/11/29/stock-market-outlook-for-november-30-2015/
Note seasonality charts on Industrial Production and S&P 500 Index during El Nino years versus average years.
Mark Leibovit comments on Disney
Folllowing is a link:
Economic News This Week
November Chicago PMI Index to be released at 9:45 AM EST on Monday is expected to slip to 55.0 from 56.2 in October
Canada’s September GDP to be released at 8:30 AM EST on Tuesday is expected to increase 0.1% versus a gain of 0.1% in August
October Construction Spending to be released at 10:00 AM EST on Tuesday is expected to increase 0.7% versus a gain of 0.6% in September
November ISM Index to be released at 10:00 AM EST on Tuesday is expected to increase to 50.4 from 50.1 in October
November ADP Private Payrolls to be released at 8:15 AM EST on Wednesday is expected to increase to 185,000 from 182,000 in October
Bank of Canada’s Interest Rate Decision is to be released at 10:00 AM EST on Wednesday. No change is expected
Fed Beige Book is scheduled to be released at 2:00 PM EST on Wednesday
Weekly Initial Jobless Claims to be released at 8:30 AM EST on Thursday is expected to increase to 267,000 from 260,000 last week.
ECB interest rate announcement is to be released at 8:30 on Thursday. Overnight rate is expected to remain at 0.05%, but another round of quantitative easing is possible.
October Factory Orders to be released at 10:00 AM EST on Thursday are expected to increase 1.1% versus a drop of 1.0% in September.
November Services ISM Index to be released at 10:00 AM EST on Thursday is expected to slip to 58.3 from 59.1.
November Non-farm Payrolls to be released at 8:30 AM EST on Friday are expected to drop to 196,000 from 271,000 in October. November Private Non-farm Payrolls are expected to drop to 190,000 from 268,000 in October. November Unemployment Rate is expected to remain unchanged from October at 5.0%.. November Average Hourly Earnings are expected to increase 0.2% versus a gain of 0.4% in October.
October U.S. Trade Deficit to be released at 8:30 AM EST on Friday is expected to slip to $40.7 billion from $40.8 billion in September
Canadian October International Merchandise Trade to be released at 8:30 AM EST on Friday is expected to remain at a deficit of $1.7 billion set in September.
Canadian November Unemployment Rate to be released at 8:30 AM EST on Friday is expected to remain unchanged from October at 7.0%. November Net Change in Employment is expected to drop 700 versus a gain of 44,400 in October
Earnings Reports This Week
Tuesday: Bank of Nova Scotia
Wednesday: American Eagle Outfitters, Gildan Activewear, National Bank, Royal Bank
Thursday: Cdn. Western Bank, Kroger, Medtronic, Sears Holdings, Toronto Dominion Bank
The Bottom Line
History is about to repeat! The month of December historically has been the strongest month of the year for North American equity markets. Strength between now and the end of the month will be helped by mildly encouraging economic news this week as well as continuing technical strength in economic sensitive sectors. Selected sub-sectors with favourable seasonal influences at this time of year (forest product, home builder and aerospace/defence stocks) continue to perform well. However, equity markets currently are overbought, face significant intermediate resistance just above current levels and are dampened by tax loss selling pressures during the next three weeks (particularly this year in the Canadian commodity sensitive sectors). Anticipation of an increase in the Fed Fund rate on December 16th also is an overhang. Beyond the first half of December, prospects for a typical Santa Claus rally are better than average. Nort American equity markets have a history of moving higher following the first increase in the Fed Fund rate. Stocks hit by late tax loss selling pressures are top candidates for a year end recovery. Preferred strategy is to take advantage of weakness in seasonally favoured equities and ETFs during the first half of December by adding to positions prior to a significant yearend rally.
Equities
Daily Seasonal/Technical Equity Trends for November 27th 2015

Green: Increase from previous day
Red: Decrease from previous day
Calculating Technical Scores
Technical scores are calculated as follows:
Intermediate Uptrend based on at least 20 trading days: Score 2
Higher highs and higher lows
Intermediate Neutral trend: Score 0
Not up or down
Intermediate Downtrend: Score –2
Lower highs and lower lows
Outperformance relative to the S&P 500 Index: Score: 2
Neutral Performance relative to the S&P 500 Index: 0
Underperformance relative to the S&P 500 Index: Score –2
Above 20 day moving average: Score 1
At 20 day moving average: Score: 0
Below 20 day moving average: –1
Up trending momentum indicators (Daily Stochastics, RSI and MACD): 1
Mixed momentum indicators: 0
Down trending momentum indicators: –1
Technical scores range from -6 to +6. Technical buy signals based on the above guidelines start when a security advances to at least 0.0, but preferably 2.0 or higher. Technical sell/short signals start when a security descends to 0, but preferably -2.0 or lower.
Long positions require maintaining a technical score of 0.0 or higher. Conversely, a short position requires maintaining a technical score of 0.0 or lower.
The S&P 500 Index added 0.94 (0.04%) last week. Intermediate trend remains up. The Index remains above its 20 day moving average. Short term momentum indicators are trending up, but are overbought.

Percent of S&P 500 stocks trading above their 50 day moving average increased last week to 70.80% from 69.80%. Percent remains intermediate overbought.

Percent of S&P 500 stocks trading above their 200 day moving average increased last week to 53.00% from 52.60%. Percent remains slightly intermediate overbought.

Bullish Percent Index for S&P 500 stocks increased last week to 68.80% from 67.00%, but remained below its 20 day moving average. The Index remains intermediate overbought.

Bullish Percent Index for TSX stocks slipped last week to 42.51% from 44.53% and remained below its 20 day moving average.

The TSX Composite Index slipped 65.25 points (0.49%) last week. Intermediate trend remains up (Score: 2). Strength relative to the S&P 500 Index remains negative (Score: -2). The Index remains below its 20 day moving average (Score: -1). Short term momentum indicators are trending up (Score: 1). Technical score remained at 0.

Percent of TSX stocks trading above their 50 day moving average increased last week to 40.49% from 40.08%.

Percent of TSX stocks trading above their 200 day moving average slipped last week to 27.53% from 28.74%.

The Dow Jones Industrial Average slipped 25.32 points (0.14%) last week. Intermediate trend remains up. Strength relative to the S&P 500 Index remains positive. The Average remains above its 20 day moving average. Short term momentum indicators are trending up, but are overbought. Technical score remained at 6.

Bullish Percent Index for Dow Jones Industrial Average stocks remained unchanged last week at 86.67% and remained below its 20 day moving average. The Index remains intermediate overbought.

Bullish Percent Index for NASDAQ Composite stocks increased last week to 51.67% from 49.70% and moved above its 20 day moving average.

The NASDAQ Composite Index gained 22.60 points (0.44%) last week. Intermediate trend remains up. Strength relative to the S&P 500 Index returned to positive from neutral. The Index remains above its 20 day moving average. Short term momentum indicators are trending up, but are overbought. Technical score improved last week to 6 from 4.

The Russell 2000 Index gained 27.23 points (2.32%) last week. Intermediate trend was extended on Friday when the Index moved above 1199.96 to complete a reverse head and shoulders pattern. Strength relative to the S&P 500 Index changed to positive from neutral. The Index remains above its 20 day moving average. Short term momentum indicators are trending up. Technical score improved last week to 6 from 2.

The Dow Jones Transportation Average dropped 86.38 points (1.04%) last week. Intermediate trend remains up. Strength relative to the S&P 500 Index returned to neutral from positive. The Average remains above its 20 day moving average. Short term momentum indicators are trending down. Technical score slipped to 2 from 6.

The Australia All Ordinaries Composite Index dropped 54.10 points (1.02%) last week. Intermediate trend remains up. Strength relative to the S&P 500 Index remains neutral. The Index remains above its 20 day moving average. Short term momentum indicators have turned mixed. Technical score slipped to 3 from 4.

The Nikkei Average gained 4.13 points (0.02%) last week. Intermediate trend remains neutral. Strength relative to the S&P 500 Index remains positive. The Average remains above their 20 day moving average. Short term momentum indicators are mixed. Technical score remains at 3.

Europe iShares added $0.08 (0.19%) last week. Intermediate trend remains neutral. Strength relative to the S&P 500 Index remains negative. Units closed at their 20 day moving average on Friday. Short term momentum indicators are trending up. Technical score improved last week to 0 from -2

The Shanghai Composite Index dropped 194.20 points (4.35%) last week. Intermediate trend remains up. Strength relative to the S&P 500 Index changed to neutral from positive on Friday. The Index fell below its 20 day moving average on Friday. Short term momentum indicators have turned lower. Technical score dropped to 0 from 5.

Emerging Markets iShares dropped $1.18 (3.36%) last week. Intermediate trend remains up. Strength relative to the S&P 500 Index returned to negative from neutral. Units moved below their 20 day moving average. Short term momentum indicators are mixed. Technical score dropped last week to -1 from 4.

Currencies
The U.S. Dollar Index added 0.50 (0.50%) last week. Intermediate trend remains up. The Index remains above its 20 day moving average. Short term momentum indicators are trending up, but are overbought

The Euro dropped 0.51 (0.48%) last week. Intermediate trend remains down. The Euro remains below its 20 day moving average. Short term momentum indicators are trending down, but are oversold.

The Canadian Dollar slipped US 0.14 cents (0.19%) last week. Intermediate trend remains neutral. The Canuck Buck remains below its 20 day moving average. Short term momentum indicators are mixed, but showing early signs of bottoming.

The Japanese Yen was unchanged last week. Intermediate trend remains down. The Yen remains below its 20 day moving average. Short term momentum indicators are trending up.

Commodities
Daily Seasonal/Technical Commodities Trends for November 27th 2015

Green: Increase from previous day
Red: Decrease from previous day
The CRB Index slipped 0.49 (0.27%) last week. Intermediate trend remains down. Strength relative to the S&P 500 Index remains negative. The Index remains below its 20 day moving average. Short term momentum indicators are trending down. Technical score improved to -4 from -6.

Gasoline jumped $0.07 per gallon (5.51%) last week. Intermediate trend remains down. Strength relative to the S&P 500 Index improved to neutral from negative. Gas moved above its 20 day moving average. Short term momentum indicators are trending up. Technical score improved to 0 from -5.

Crude oil slipped $0.19 per barrel (0.45%) last week. Intermediate trend remains down. Strength relative to the S&P 500 Index remains negative. Crude remains below its 20 day moving average. Short term momentum indicators are trending up. Technical score improved last week to -4 from -5.

Natural gas dropped $0.08 per MBtu (3.50%) last week. Intermediate trend remains down. Strength relative to the S&P 500 Index turned negative. Natty remains below its 20 day moving average. Short term momentum indicators are trending down. Technical score fell last week to -6 from -1.

The S&P Energy Index added 6.48 points (1.32%) last week. Intermediate trend remains neutral. Strength relative to the S&P 500 Index remains neutral. The Index remains below its 20 day moving average. Short term momentum indicators are trending up. Technical score improved last week to 0 from -1

The Philadelphia Oil Services Index added 2.95 points (1.70%) last week. Intermediate trend remains up. Strength relative to the S&P 500 Index remains neutral. The Index remains below its 20 day moving average. Short term momentum indicators are trending up. Technical score improved to 2 from 0.

Gold dropped $20.10 per ounce (1.87%) last week. Intermediate trend remains down. Strength relative to the S&P 500 Index remains negative. Gold remains below its 20 day moving average. Short term momentum indicators are mixed. Technical score remained last week at -5

Silver lost $0.05 per ounce (0.35%) last week. Intermediate trend changed to down from neutral on a move below $13.91. Strength relative to the S&P 500 Index remains negative. Silver remains below its 20 day moving average. Short term momentum indicators are mixed. Technical score slipped last week to -5 from -4. Strength relative to gold improved to neutral

The AMEX Gold Bug Index gained 0.27 (0.25%) last week. Intermediate trend remains down. Strength relative to the S&P 500 Index improved to neutral from negative. The Index remains below its 20 day moving average. Short term momentum indicators are trending up. Technical score remained at -2.

Platinum dropped $20.10 per ounce (2.35%) last week. Intermediate trend remains down. Relative strength remains negative. PLAT remains below its 20 day MA. Momentum: Down

Palladium dropped $9.30 per ounce (1.66%) last week. Trend remains neutral. Strength relative to the S&P 500 and gold remains negative. PALL remains below its 20 day moving average. Short term momentum indicators are trending up. Score improved to -2 from -3

Copper was unchanged last week. Intermediate trend remains down. Strength relative to the S&P 500 Index remains negative. Copper remains below its 20 day moving average. Short term momentum indicators are trending down, but are oversold and are showing early signs of bottoming. Technical score remains at 6.

The TSX Metals & Mining Index fell 5.89 points (1.66%) last week. Intermediate trend changed to down from neutral on a move below 339.80. Strength relative to the S&P 500 Index remains negative. The Index remains below its 20 day moving average. Short term momentum indicators are trending down, but are oversold and showing early signs of bottoming. Technical score dropped last week to -6 from -4.

Lumber slipped $5.00 (1.98%) last week. Trend remains neutral. Lumber remains above its 20 day MA. Relative strength remains neutral. Momentum indicators are trending up. Score: 2.

The Grain ETN slipped $0.04 (0.13%) last week. Trend remains down. Relative strength remains negative. Units remain below their 20 day moving average. Short term momentum indicators are trending up. Technical score improved last week to -4 from -6

The Agriculture ETF added $0.68 (1.42%) last week. Intermediate trend remains neutral. Strength relative to the S&P 500 Index remains neutral. Units moved above their 20 day moving average. Short term momentum indicators are trending up. Technical score improved last week to 2 from 0

Interest Rates
Yield on 10 year Treasuries dropped 3.7 basis points (1.64%) last week. Intermediate trend remains up. Units fell below their 20 day moving average. Short term momentum indicators are trending down.

Conversely, price of the long term Treasury ETF gained $0.52 (0.43%) last week. Units moved above their 20 day moving average.

Other Issues
The VIX Index dropped 0.63 (4.00%) last week. The Index remains below its 20, 50 and 200 day moving averages.

Earnings news this week is quiet. The focus is on Canada’s banks. Fiscal fourth quarter earnings per share on a year-over-year basis are expected to be up approximately 10%. Seasonal influences change from positive to negative following release of fourth quarter results. Seasonal investors will be taking profits this week.
Consensus shows that fourth quarter earnings per share and revenues by S&P 500 companies generally are negative followed by first quarter 2016 earnings per share and revenues that generally are positive. According to FactSet, fourth quarter earnings per share are expected to decline 4.2% on a year-over-year basis while revenues are expected to fall 2.9%. Most of the declines can be attributed to strength by the U.S. Dollar Index. First quarter earnings per share in 2016 are expected to increase 2.1% and revenues are expected to gain 3.0%. To date, 81 S&P 500 companies have issued negative fourth quarter earnings per share guidance while 26 companies have issued positive guidance.
Short and intermediate technical signals are trending up and are overbought, but early signs of peaking have yet to appear. Tax loss selling pressures during the next three weeks are expected to dampen upside momentum in equity prices. Thereafter, a strong recovery (Santa Claus rally) is likely.
The month of December has been the strongest month of the year since 1950 for the S&P 500 Index. Average gain for the S&P 500 Index was 1.67%. Frequency of gains was 75%. The month of December also was the strongest month of the year for the TSX Composite Index. Average gain during the past 27 periods was 2.3%. Frequency of gains was 87%.
Lots of economic news this week in the U.S. and Canada! Most are expected to show a mild re-acceleration in the U.S. economy. Focus is on the November employment report to be released on Friday.
Technical action by individual S&P 500 stocks last week was quietly bullish. Twenty three stocks broke resistance and five stocks broke support. Notable on the list of stocks breaking resistance were six Consumer Discretionary stocks.
International focus is on the European Central Bank’s announcement on Thursday morning. Additional monetary stimulus is expected. China’s November PMI reports on Tuesday also will be watched. Consensus is for a slight decline from October.
FP Trading Desk Headline
FP Trading Desk headline reads “ECB may hit market with three doses of stimulus”. Following is a link: http://business.financialpost.com/investing/trading-desk/ecb-may-hit-market-with-three-doses-of-stimulus
Sectors
Daily Seasonal/Technical Sector Trends for November 27th 2015

Green: Increase from previous day
Red: Decrease from previous day
StockTwits Released on Friday
Technical action by S&P 500 stocks to 10:00 AM: Quiet. Breakout: $AME. No breakdowns.
Editor’s Note: Two more stocks broke resistance after 10:00 AM: LEG and PKI.
Nice breakout by the Russell 2000 Index and its related ETF $IWM to complete a reverse head and shoulder pattern.

‘Tis the season for Russell 2000 Index and $IWM to outperform the S&P 500 Index between November 23rd and March 4th

Nice breakout by the U.S. Medical Devices ETF $IHI above $123.53 to extend an intermediate uptrend.

Nice breakout by NASDAQ Biotech ETF $IBB above $341.24 to extend an intermediate uptrend!

Special Free Services available through www.equityclock.com
Equityclock.com is offering free access to a data base showing seasonal studies on individual stocks and sectors. The data base holds seasonality studies on over 1000 big and moderate cap securities and indices. To login, simply go to http://www.equityclock.com/charts/
Following is an example:
|
Crude Oil Futures (CL) Seasonal Chart
|


Disclaimer: Seasonality and technical ratings offered in this report by www.timingthemarket.ca and www.equityclock.com are for information only. They should not be considered as advice to purchase or to sell mentioned securities. Data offered in this report is believed to be accurate, but is not guaranteed.
Copyright © DV Tech Talk, Timingthemarket.ca