


Are We About to See An Increase in Volatility?
One of the many tools in technical analysis are Bollinger Bands, which measure a set standard deviation price has traveled from a defined Simple Moving Average, in a way it’s measuring the volatility of a price move. Many traders often use Bollinger Bands as levels of potential support and/or resistance. However, I’m much more concerned with the distance between the bands themselves. Which, when applied to the Volatility Index, is showing signs of a potential rise in the $VIX.
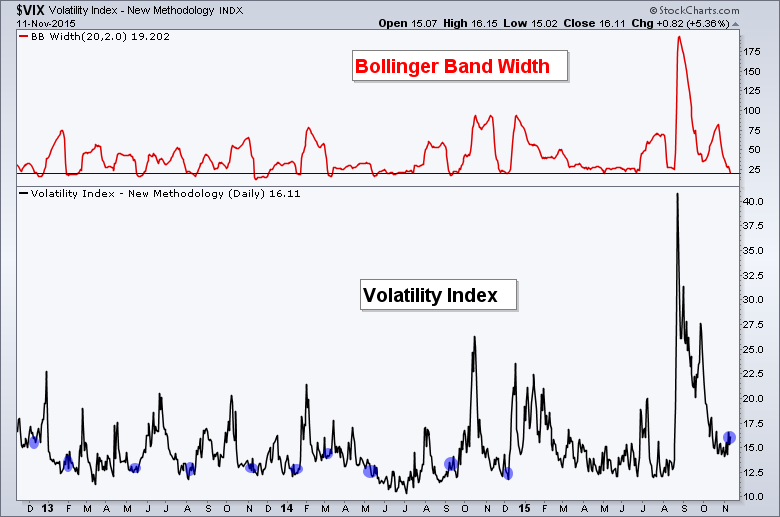
When the upper and lower Bollinger Bands compress, it’s a result of a lack of change as measured by standard deviation, in this case, over the last 20 trading days. History has shown us that when this compression in the width of the Bollinger Bands for Volatility gets low enough, it has preceded spikes. Below is a chart of the $VIX over the last three years, with the width of the Bollinger Bands shown in the top panel. I’ve put blue dots on the VIX when the width has fallen below 20. While the $VIX hasn’t spiked immediately following every instance of this occurring, many large moves in volatility have followed such a compression in the Bands.
To shine a little more light on this topic, below is a list of times we’ve seen the bands width fall below 20 for the first time in two weeks and the $VIX itself was below 25. While the percentage of the time volatility was higher the next 1, 2, 3, 5, 10, 15, and 20 days ranges from 43% to 65%, what stands out to me is the minimum and maximum changes. Typically the minimum move over the shown periods of time is less than 10%, the maximum advances in volatility have been quite large – the mid-double digits.
Even though the number of instances the $VIX has risen has been low (typically less than 50% depending on the time period), when it does go higher we have seen some very strong moves to the upside in volatility. With the width of the bands now sitting under 20, it’s possible we see volatility pick up over the coming two weeks, if not sooner.
Understanding the probabilities and potential outcomes of historical market data is an important tool to being a successful trader.

Disclaimer: Do not construe anything written in this post or this blog in its entirety as a recommendation, research, or an offer to buy or sell any securities. Everything in this post is meant for educational and entertainment purposes only. I or my affiliates may hold positions in securities mentioned in the blog. Please see my Disclosure page for full disclaimer. Connect with Andrew on Google+, Twitter, and StockTwits.
Copyright © Andrew Thrasher