Buying stocks is a coin toss on an annual basis. On a decade basis ...
by Ben Carlson, A Wealth of Common Sense
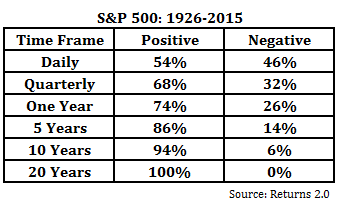
The following is one of my favorite running stats on the stock market:
Over the years I’ve noticed that whenever these types of long-term numbers are presented there tend to be two extreme responses:
- See, put your money in stocks, close your eyes and you’ll be fine in a couple decades.
- Who has a twenty year time horizon? How many people have the patience to wait that long?
There is some truth in each of these statements, but as with most things the historical data is never black or white, but a shade of gray. The future is uncertain, so investors should always think in terms of probabilities, never guarantees. What this data tells me is that the longer your time horizon, the higher your probability of seeing a gain in the stock market.
Does this mean that you’re guaranteed to earn a certain level of returns in stocks if you hold them for a specfied time frame? No.
Will these same results be guaranteed to repeat themselves in the future? No.
Has anyone figured out a better way of compounding your money in stocks beyond increasing your holding period? Not many.
Are there investors out there who actually have twenty year time horizons? Absolutely — Millennials just starting out in their career, middle-aged workers playing catch-up with their retirement savings and even retirees who will likely have 2-3 more decades to invest during their retirement years. The difference in each case comes down to how much each of these investors should hold in stocks and what their needs are in the meantime.
I like to think that every single retirement contribution has it’s own twenty or thirty year time horizon.
The usual caveats apply here — these numbers are before inflation, taxes or costs are taken into account (although one of the biggest benefits about a longer holding period is that you can reduce the impact of trading costs and taxes on your portfolio). With that disclaimer out of the way, here are a few more interesting long-term stock market stats I found while computing these numbers:
- The worst total return over a 20 year period was 54%. But the worst 30 year total return was 854%.
- The standard deviation of annual returns over 20 and 30 year time frames has been remarkably low — just 1.3% and 2.8%, respectively. The volatility in returns has historically fallen off a cliff as you extend the time horizon in the market.
- Volatility in the stock market during the 1930s was insane. Not only did the market drop more than 80% during the Great Depression, but during that period there were two separate quarters that saw stocks rise in excess of 80%.
- In contrast to the large losses seen in 1930s, the bull market of the 1980s and 1990s produced an amazing run of gains for long-term investors. If you would have invested at any point between 1973 and 1985 you would have earned anywhere from 12-18% per year over the following twenty years.
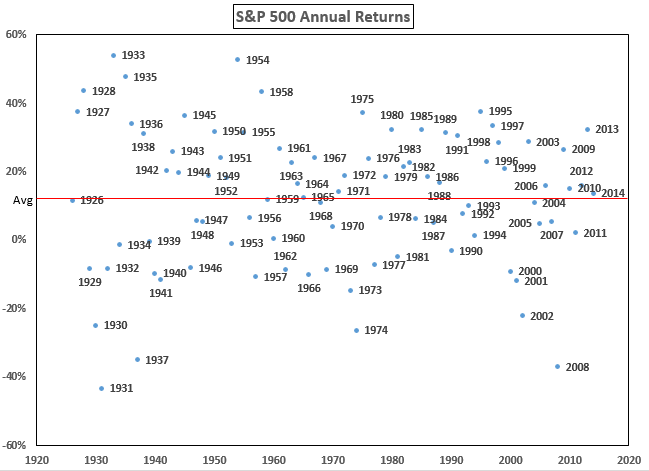
- Annual returns are all over the place and rarely do investors experience average performance in any given year as you can see from this graph:
Further Reading:
What Constitutes Long-Term in the Stock Market?
Subscribe to receive email updates and my quarterly newsletter by clicking here.
Follow me on Twitter: @awealthofcs
My new book, A Wealth of Common Sense: Why Simplicity Trumps Complexity in Any Investment Plan, is out now.


