
Durable goods orders on pace to record a contraction for 2015.
by Don Vialoux, EquityClock.com
**NEW** As part of the ongoing process to offer new and up-to-date information regarding seasonal and technical investing, we are adding a section to the daily reports that details the stocks that are entering their period of seasonal strength, based on average historical start dates. Stocks highlighted are for information purposes only and should not be considered as advice to purchase or to sell mentioned securities. As always, the use of technical and fundamental analysis is encouraged in order to fine tune entry and exit points to average seasonal trends.
Stocks Entering Period of Seasonal Strength Today:
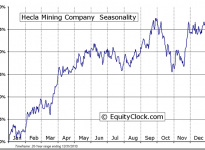
Hecla Mining Company (NYSE:HL) Seasonal Chart
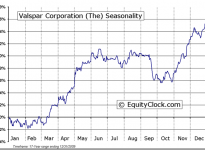
The Valspar Corporation (NYSE:VAL) Seasonal Chart
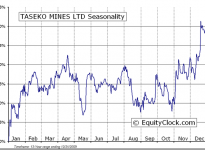
Taseko Mines Limited (TSE:TKO) Seasonal Chart
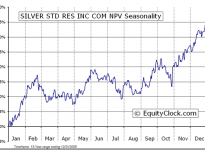
Silver Standard Resources Inc. (TSE:SSO) Seasonal Chart
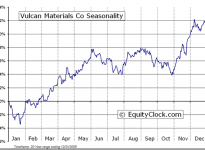
Vulcan Materials Company (NYSE:VMC) Seasonal Chart
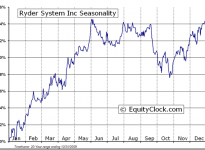
Ryder System, Inc. (NYSE:R) Seasonal Chart
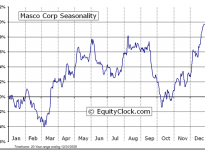
Masco Corporation (NYSE:MAS) Seasonal Chart
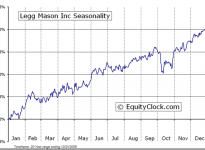
Legg Mason, Inc. (NYSE:LM) Seasonal Chart
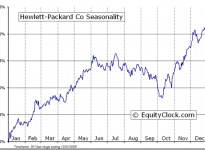
Hewlett-Packard Company (NYSE:HPQ) Seasonal Chart
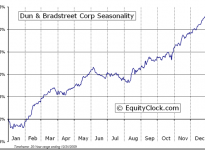
The Dun & Bradstreet Corporation (NYSE:DNB) Seasonal Chart
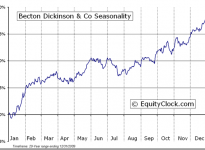
Becton, Dickinson and Co. (NYSE:BDX) Seasonal Chart
The Markets
Stocks flip-flopped on Tuesday with health care posting solid gains while the rest traded flat to lower, digesting recent gains ahead of the FOMC announcement to be released today. Better than expected results from Pfizer and Merck helped to fuel the uptick in beaten-down health care names. The S&P 500 Pharmaceutical and Biotechnology Industry Index traded higher by 2.18%, attempting to trade back to resistance around the 200-day moving average. The relative trend of the industry benchmark (vs. the S&P 500 Index) is showing early signs of improvement as investors seek value in this market segment, which has been subjected to so much scrutiny over its pricing practices. Seasonally, pharmaceutical stocks are typically strong through October, but the heightened pessimism has mitigated the positive tendencies. Gains for the industry seasonally continue, on average, through the end of the year, however, its performance relative to the sector typically fades in the last six to eight weeks of the year.


S5PHARX Index Relative to the Sector 

The minor declines recorded in the broader market saw the S&P 500 Index chart its first successful test of support around the 200-day moving average; the benchmark bounced from this level intraday. Looking at an hourly chart of the benchmark over the past month, price remains above a short-term rising trendline and major hourly moving averages continue to point higher. The large-cap index continues to battle with overhead resistance presented by the all-time highs as investors that were stuck in positions following the late summer plunge look to get out closer to their purchase price. Without a catalyst, it may take some time to eat away at the overhead “froth.”


On the economic front, a report on durable goods orders for September continued with the trend of recent economic misses. The headline print showed that new orders for durable goods declined by 1.2% last month, below the consensus estimate of a decline of 1.0%. Excluding the more volatile transportation component, orders were still down a worse than expected 0.4%, missing the estimate of a decline of 0.1%. Stripping out seasonal adjustments, the Value of Manufacturers’ New Orders for Capital Goods Industries was higher in September by 10.8%, around half of the average gain for September of 20.2%, based on data over the past 20 years. As a result of the lag in September, the year-to-date change of -16.5% remains below the average change of –7.8% through the first three quarters. An end of fourth quarter surge typically puts the average annual change in the plus column, but with the present lag versus the average, 2015 may be on pace for a full year contraction. In addition to the drag imposed by earnings, the industrials sector ended firmly lower following the report as the period of seasonal strength for the broad sector gets set to begin.


Sentiment on Tuesday, as gauged by the put-call ratio, ended close to neutral at 0.99.

Sectors and Industries entering their period of seasonal strength:

^SOX Relative to the S&P 500 


^RUA Relative to the S&P 500 


^RUI Relative to the S&P 500 


DISCRETIONARY Relative to the S&P 500 

Seasonal charts of companies reporting earnings today:


Click here to view the seasonal charts of the remaining companies reporting earnings today.
S&P 500 Index


TSE Composite