Under the Tuscan Sun
by Jeffrey Saut, Chief Investment Strategist, Raymond James
Frances: Do traffic lights mean anything around here?
Marcello: Sure. Green light - avanti, avanti. Yellow light - decoration.
Frances: What about a red light?
Marcello: Just a suggestion
. . . Under the Tuscan Sun (2003)
While the above quote is from the 2003 movie “Under the Tuscan Sun” it could just as well apply to this year’s “stop and go” stock market. Obviously we are back, back from two weeks in Tuscany with 32 of our best and dearest friends. The group included industrialists, the heads of European operations for two of the largest clothing/shoe companies in the world, an L.A.-based reality TV producer, tax attorneys, the CEO of a large title insurance company . . . well, you get the idea. Other than three days in Florence (Firenze), the group spent most of its time on day trips from the fabulous 300+ hectare estate of Camporsevoli (see exhibit 1 on page 3). The property, located atop a 2100’ hill in Tuscany, consists of a number of homes, villas, and apartments. The property has been owned by the Grossi family since 1820 and is currently under the tutelage of Pierfrancesco and Elena Grossi, who were kind enough to arrange two separate cocktail parties for the group. Our main point of contact, however, was one of their daughters, Valentina, who had Maria and Franca fix us breakfast every morning, as well as a few dinners. Anyone looking for a parsimoniously priced basecamp for day trips to the various towns in the wondrous Tuscany region (Siena, Montalcino, Cortona, Montepulciano, Orvieto, etc.), will not do better than Camporsevoli, but I digress.
So what has happened in my absence? The answer is, not very much, at least that was the case up until last Thursday. Indeed, when we boarded the plane more than two weeks ago the S&P 500 (SPX/2075.15) was changing hands around 2020, and as of last Wednesday it stood at ~2019, but then it happened. While many U.S. pundits attributed much of last Thursday’s Triumph (+320 Dow points) to some better than expected earnings reports, from Europe it was a totally different perspective. Our Tuscany group’s discussion centered on the ECB’s chief, Mario Draghi, whose early Thursday morning statement (10/21/15) was clear and concise – the ECB will expand its easy-money policies – his statement was utterly transparent. Mr. Draghi did not even hide behind the often used mime “data dependent!” And with that as a catalyst, stocks soared, leaving the SPX up 56 points into its weekend close from last Wednesday’s level. The rally has left the SPX probing overhead resistance levels (read: supply), but has also turned that index positive on the year. Also of note is the markets are not overbought on a trading basis. That said, Friday’s Advance/Decline Line was terrible, for as the SentimenTrader’s keen-eyed Jason Goepfert opines:
Friday was one of the worst breadth days in history for such a good day. Since 1940, there have been 560 days when the S&P 500 rallied at least 1% to a two-month high. Of those, 553 days showed more than 60% of NYSE volume flow into issues that were positive on the day. That leaves only 7 days when the Up Volume Ratio was less than 60%, including Friday. All of the other instances are shown in the table on the next page. It's tough to draw conclusions from such a small sample, so when we expand the search to be less-bad, the negativity persists, particularly during the next week. We'd consider this to be market-negative.
Speaking basically to this same point, the “must have” Lowry’s organization writes:
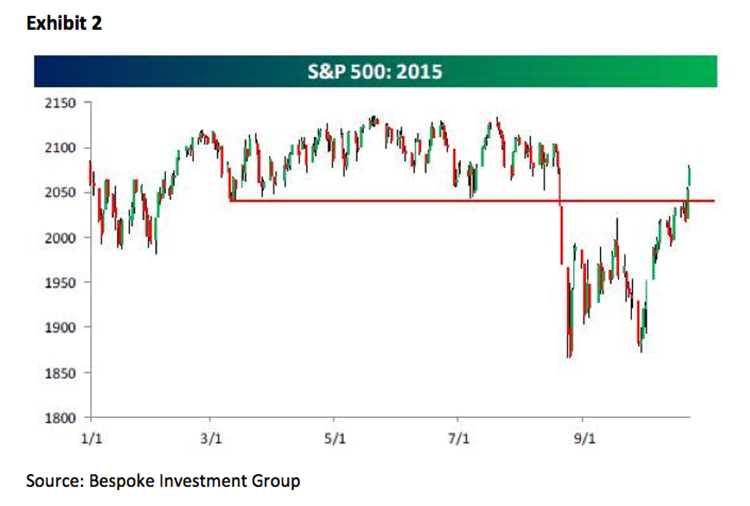
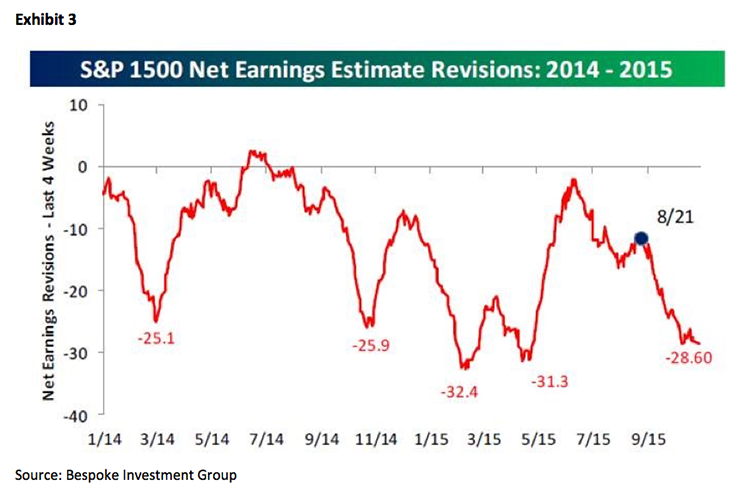
[Lowry’s historical database] dictates that if an important market bottom occurred in late Aug., we should be seeing a strong uptrend in our Buying Power Index and in our Short Term Index, accompanied by a sharp drop in our Selling Pressure Index. However, since Aug. 25, Buying Power has increased by a relatively sluggish 17 points, while our usually volatile Short Term Index has risen by just 6 points. During the same time, our Selling Pressure Index has dropped by only 17 points – all far less than typically found at the start of important, broad market advances.I would add to Lowry’s comments that typically, when a new leg to the upside has commenced, the small/mid-capitalization stocks tend to lead the way, and this is just not happening. So, as I study the charts, all that has occurred is for the SPX to rally back into the 2050 – 2130 trading range it has been trapped in for much of this year (exhibit 2). Meanwhile, the backdrop remains pretty much the same. While it’s true after weeks of not so hot economic news, last week’s reports took a turn for the better. Corporate revenue growth, however, is still abysmal with only 42.8% of reporting companies beating estimates. Yet, 60% of reporting companies have bettered their respective earnings estimates, with the top three sectors’ “beat rate” being: Telecom (75%); Healthcare (74%); and Technology (74%). Despite that “beat rate,” analysts’ net earnings revisions continue to weaken (exhibit 3), calling into question the S&P’s 2016 bottom up (operating) earnings estimate of $127.88, leaving next year’s estimated P/E ratio at 16.2x, somewhat pricey. Given that, any of investors’ worries could cause another pullback, with the biggest “worry” being China’s slowing GDP growth and the attendant weakness in the commodity complex.
Like others, our Tuscany group discussed this China syndrome question with my input suggesting China is not a problem. Much has been written about China’s overinvestment in roads, houses, infrastructure, office space, etc. driven by excessive credit expansion. With the slowing of those “sleeves,” and the concurrent cessation of China’s appetite for raw materials (copper, coal, iron ore, zinc, etc.), worries have swirled about a recession in China. Lost in the translation has been the shift in Chinese consumption patterns. For example, while heavy equipment sales to China have fallen off a cliff, food imports for households are up by more than 20%. Further, iPhone sales have surged (+70%) and Nike sales have jumped by more than 25%. Verily, it is much as we have suggested over the past few years, believing China is transforming its business model from a manufacturing/export driven economy to one of more domestic demand; and, that’s exactly what is happening. Obviously there were many more questions/discussions by our group, but I have run out of space, so I will leave you with this one. Why, after YEARS of Mideast conflicts, is it just now that Europe is being invaded with refugees?! . . . Great question!
The call for this week: Our model gave us a two-week lead time in early July by telegraphing the ensuing period of contraction for the equity markets. It did not, however, tells us the correction would be as severe as it was. It did “call” the “capitulation low” of August 24/25th (SPX @1867), and subsequently Andrew and I discussed the typical “bottoming process” of a capitulation low followed by various rally attempts. Those rally attempts usually peter-out, leading to a retest of the capitulation low. We saw that retest on 9/29/15 at SPX ~1872, and said so, telling aggressive trading-types to buy positions and giving investors more conservative investment ideas. So far those suggestions have done okay, but from here the investment equation becomes more difficult. The bulls embrace the thought we have enter the fabled year-end rally phase, while the bears point to China, weakening earnings, a Fed tightening cycle, China selling U.S. Treasuries, emerging market consternations, et all. We remain optimistic on a longer-term basis, but realize the reality of the Dow Theory “sell signal” has NOT been reversed. Accordingly, after the envisioned August lows, while we continue to embrace the upside, we do so with a cautionary bias on a near-term trading basis, consistent with our major investment mantra of “Do no harm!” This week we look for a trading top, but the decline should not be all that bad with the Chinese rate cut, the FOMC meeting, and the BOJ’s policy statement all auguring for more quantitative easing.

Copyright © Jeffrey Saut, Chief Investment Strategist, Raymond James