
SIA Weekly: What's up with Natural Gas and Oil?
For this week's Equity Leaders Weekly, we will examine some key Commodities in Natural Gas and Crude Oil. Natural Gas has continued to decline to lower levels over the past 2 years now challenging some of the lows from 2012. Crude Oil took a mighty fall last October around this time breaking through long-term trend lines to around half of its value to where it now sits in the $44 to $55 range.
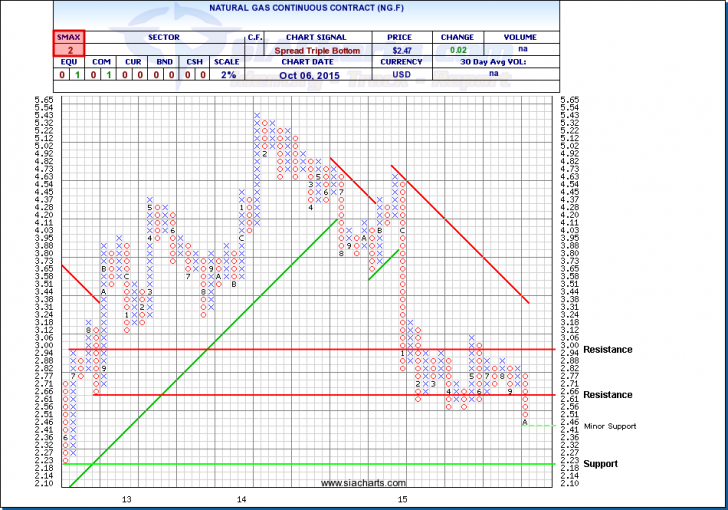
Natural Gas Continuous Contract (NG.F)
Natural Gas has been falling in prices since the beginning of 2014 to around half of its value now to multi-year lows around the $2.50 level where prior support was at $2.51 before it moved through this level last month. Resistance above is now found at $2.66 and still at $3 if NG.F does reverse. With the SMAX sitting at 2, NG.F is showing short-term weakness across all asset classes. Keep a close eye on the minor support level at $2.41 and again below that at $2.18 for further support to the downside.
On an asset class level, Commodities continues to sit down as the weakest of the 7 asset classes from a long-term strength perspective. Although there is always short-term trading opportunities with any commodity, from a long-term perspective, the supply/demand relationship for natural gas continues to put downward pressure on prices from more North American production, additional storage, less exports to the U.S., etc. are all affecting the outlook for natural gas companies. ALA.TO, APC, CHK, COP, DVN, ECA.TO, ENB.TO, FTS.TO, PGF.TO, SWN, and XOM are some of the main stocks to watch that could be directly affected by the raising/falling of Natural Gas prices as well as other considerations.
Click on Image to Enlarge
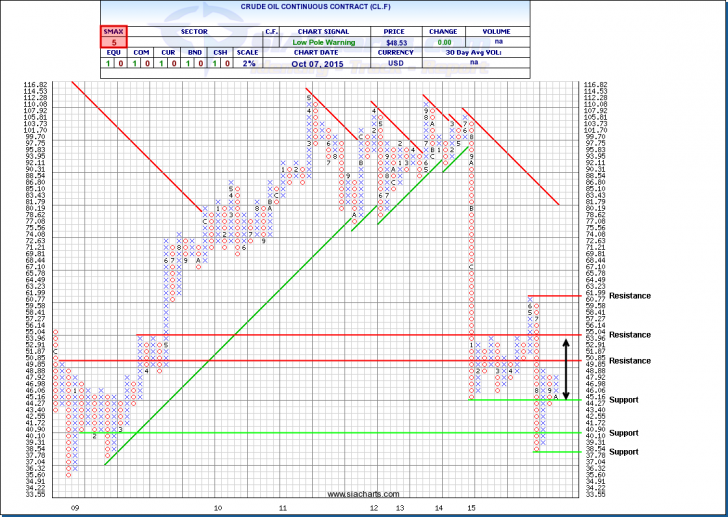
Crude Oil Continuous Contract (CL.F)
The point and figure chart of the Crude Oil Continuous Contract (CL.F) shows this commodity's trading since the beginning of 2009 to help show where some of the key resistance and support levels are coming from. To the upside, resistance can be found at $50.85 and at $55.04, which has been the main top of the trading range so far for Crude Oil this year. To the downside, support is found at $44.27 and below this at $40.10 and at the low of this year, $37.78. CL.F is still showing some near-term weakness with an SMAX score of 5 out of 10 comparing to all asset classes.
It is really interesting to look at the trading range so far this year for Crude Oil as it has been very range bound between $44 and $55 for a majority of the year so far. Outside of this range, it has moved up $62 briefly in the spring and then down to $37 in August briefly as well and then back into the trading range. So keeping this in mind, even though Crude Oil is up ~7.6% in the last week as of Tuesday's close, it is still showing losses of approx. -8.9% this year and -45.4% over the last year. The continued analysis of the supply/demand relationship through relative strength compared to other opportunities continues to be an important investment to monitor to help us understand if this trading range will continue to hold or if other macro events will cause a change in long-term outlook for Crude Oil.
Click on Image to Enlarge
For a more in-depth analysis on the relative strength of the markets, commodities, currencies or for more information on SIACharts.com, you can contact our customer support at 1-877-668-1332 or siateam@siacharts.com.
SIACharts.com specifically represents that it does not give investment advice or advocate the purchase or sale of any security or investment. None of the information contained in this website or document constitutes an offer to sell or the solicitation of an offer to buy any security or other investment or an offer to provide investment services of any kind. Neither SIACharts.com (FundCharts Inc.) nor its third party content providers shall be liable for any errors, inaccuracies or delays in content, or for any actions taken in reliance thereon.