


Outlook for USDCAD and 30-year treasury yields
It has been a number of months since we last looked at the USDCAD relationship and the CBOE 30 Yr Interest Rate, and in the that time there have been some interesting movements in both those charts. So for this week's SIA Equity Leaders Weekly we are going to look back on both of these and see what has happened recently.
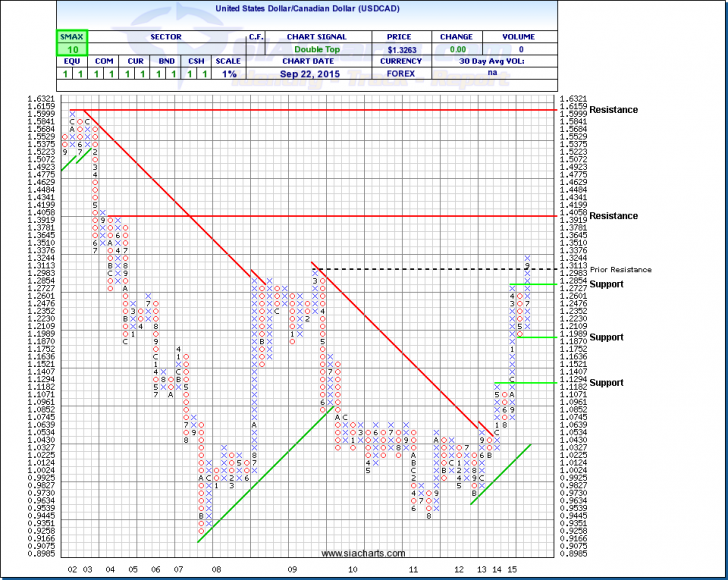
United States Dollar/Canadian Dollar (USDCAD)
Back on July 15th, 2015 we reported that the currency pair just broke through resistance at the $1.2854 level and was closing in on further resistance at $1.31. Looking at the chart we can see that the USDCAD broke through that level earlier this month and is now wide open for further possible moves up to the $1.40 major resistance and psychological level. If by chance the momentum runs out, support levels are now seen at $1.2727, $1.1870, and lower at $1.1182.
With the continued strength in the US dollar we have seen the continued weakness in most commodity influenced economies as well as specific investments within both the Energy and Materials sectors.
Click on Image to Enlarge
CBOE Interest Rate 30 - YR (TYX.I)
When we last looked at the TYX.I back in mid-May, we discussed the substantial bounce off the 2.442% level up to resistance at around 3.097%. Up until late June, the index continued its upside move all the way up to current resistance at 3.272%. But since then, we have been range bound between the 2.709 support and that 3.272 resistance.
Much of the tug-a-war has to do with the continued debate on the strength of the economy, inflation outlook, and the never ending discussion on possible interest rate hikes by the Federal Reserve in the US. Last weeks decision not to raise rates but comments afterwards that a rate increase this year still remains in the cards added continued uncertainty as to the when, and by how much.
What is interesting is that the SMAX is still at a 10, again showing short term strength across all the asset classes.
Both of these charts continue to give us relevant information that we need to monitor in order to make important decisions for our clients. Further updates can be anticipated.
Click on Image to Enlarge

SIACharts.com specifically represents that it does not give investment advice or advocate the purchase or sale of any security or investment. None of the information contained in this website or document constitutes an offer to sell or the solicitation of an offer to buy any security or other investment or an offer to provide investment services of any kind. Neither SIACharts.com (FundCharts Inc.) nor its third party content providers shall be liable for any errors, inaccuracies or delays in content, or for any actions taken in reliance thereon.
For any questions on this article, please call or email us at 1-877-668-1332 or siateam@siacharts.com.
Copyright © SIACharts.com