A few more signs that the pain in EM is ending
While the uptick in volatility makes everyone stare a little harder at their screens each day, the median stock in the developed world is actually only down 3% (in USD) over the past year. This is better performance than we had from for the majority of the period from October 2011 – July 2012. However, for emerging market investors 2015 has been a much rougher ride. The median stock is down -19% over the past. The good news for EM investors is that there are signs emerging that the major pain in the emerging markets is nearing an end. About a month ago Bryce noted that it seemed that we may have seen the emotional low in EM stocks. In addition, analysts haven’t been this negative on EM stocks since the financial crisis which is a good thing for forward-thinking investors. As we go through our market internal data, more and more data points suggest that the worse of the EM slide is over (unless we are entering a 2008 situation).
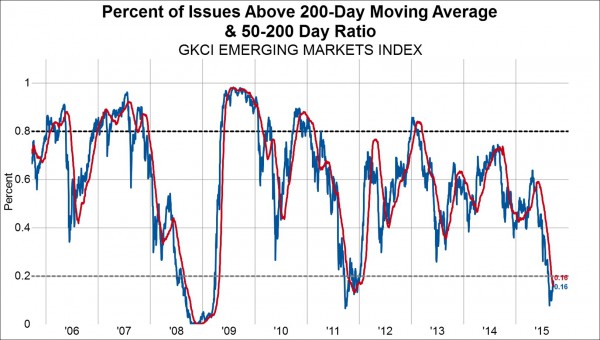
For example, we have seen a doubling in the number of stocks that are trading above its 200-day moving average from just 8% on 8/24 to a still low level of 16%. More importantly, the percentage of stocks with its 50-day moving average above its 200-day average has fallen to 16% as well. When the percentage of stocks trading above its 200-day moving average starts to trade above the 50-200 day ratio at extreme levels such as where we are currently, this tends to be an indication that momentum has changed. It some cases it means that momentum is now positive but at the very least it means momentum has moved from negative to neutral.
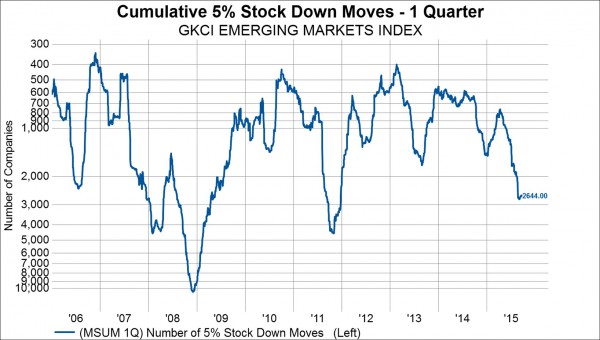
The one-quarter moving sum of stocks with 5% down days has stopped increasing as well. In the chart below, while early no doubt, it seems that this series should begin to improve (not that this chart is inverted).
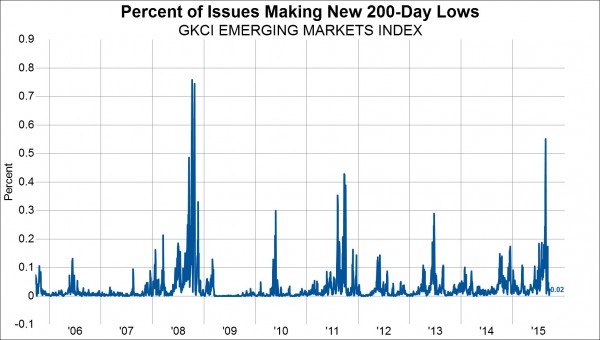
New 200-day lows has snapped back from its extreme level of 55% on 8/24. The latest reading is just 2%. Outside of the financial crisis, we haven’t seen more EM stocks make new 200-day lows at any point over the past decade than we did on 8/24.
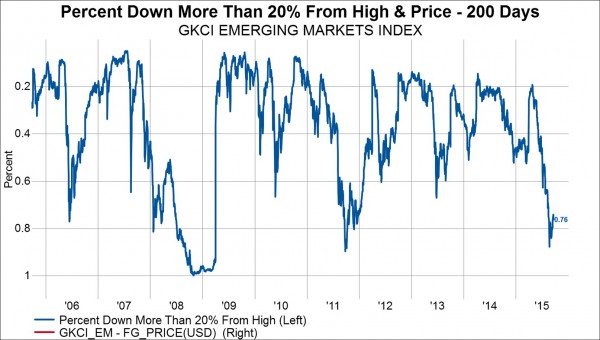
Finally, the percent of stocks that are at least 20% from its 200-day high has “improved” to 76% from 88% on 8/24. This chart below seems to be tracing out a 2011 style drawdown rather than the 2008 “end of the world” scenario. On October 30th, 100% of all EM stocks in the GKCI EM Index were in a bear market, a level that is almost hard to believe. In 2011 the nadir was 90% and so far in 2015 the nadir is 88%.
All in all, the market internal data in 2015 is beginning to look a lot like the internal data we saw in 2011 and fortunately, not like 2008. Baring some major event that shakes sentiment further, it would seem that the future for EM stocks is finally looking brighter.
Sign up for reports from Gavekal Capital
Copyright © Gavekal Capital


