
Equity Action Call Shifts into Neutral, Asset Class Ranking Sees Dramatic Changes
For this week's SIA Equity Leaders Weekly, we are going to look deeper into the recent changes within our Asset Class Rankings and also to the SIA Equity Action Call (EAC).
Late last week the EAC moved from the Green Favored Zone into the Yellow Neutral Zone. What this means in practical terms is that the risk vs. reward for equities has increased and we need to be cautious moving forward. The Neutral Equity Action Call is seen as a "Hold" or "Caution" area where new purchases will not be made in the equity asset class, but instead to the highest ranked non-equity alternative.
On Tuesday August 25th, after the market close, we saw some dramatic changes to our Asset Class Rankings: Bonds moved up to the number one ranked asset class with US Equity moving down to second position, Cash moved up to third, Currency to fourth, International Equity dropped to fifth, and Canadian Equities and Commodities down in sixth and seventh position respectively.
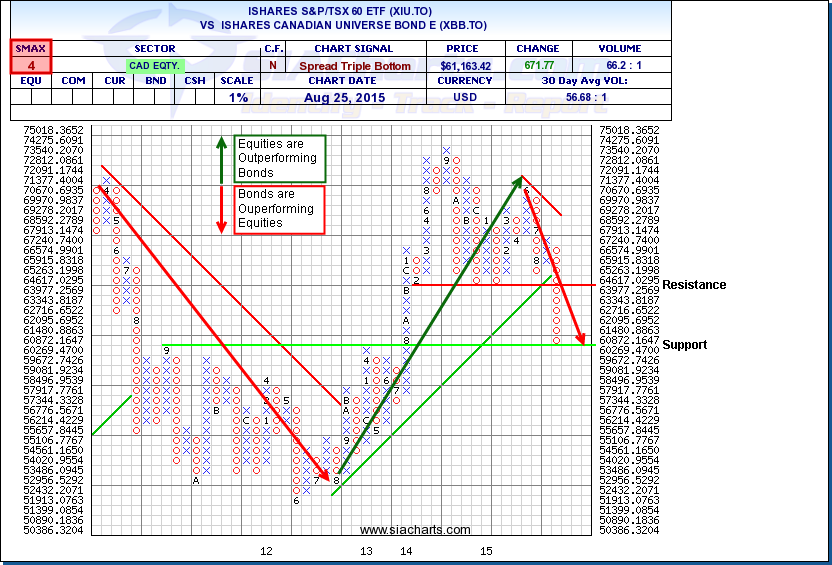
iShares S&P/TSX 60 ETF (XIU.TO) vs. iShares Canadian Universe Bond ETF (XBB.TO)
Looking at the comparison chart of the iShares S&P/TSX 60 Index ETF vs. iShares Canadian Universe Bond Index ETF, we see that the relative outperformance of Canadian equities starting in 2012 came to an end recently with the breaking of its long-term uptrend line. Prior to that, we can see the significant outperformance of the Bond index in 2011. We are currently sitting at a major support level on the comparison chart for these two asset class ETFs. Pay attention to what happens next; whether we see a rebound back up to the current resistance level, or further relative equity weakness below the current level.
Click on Image to Enlarge
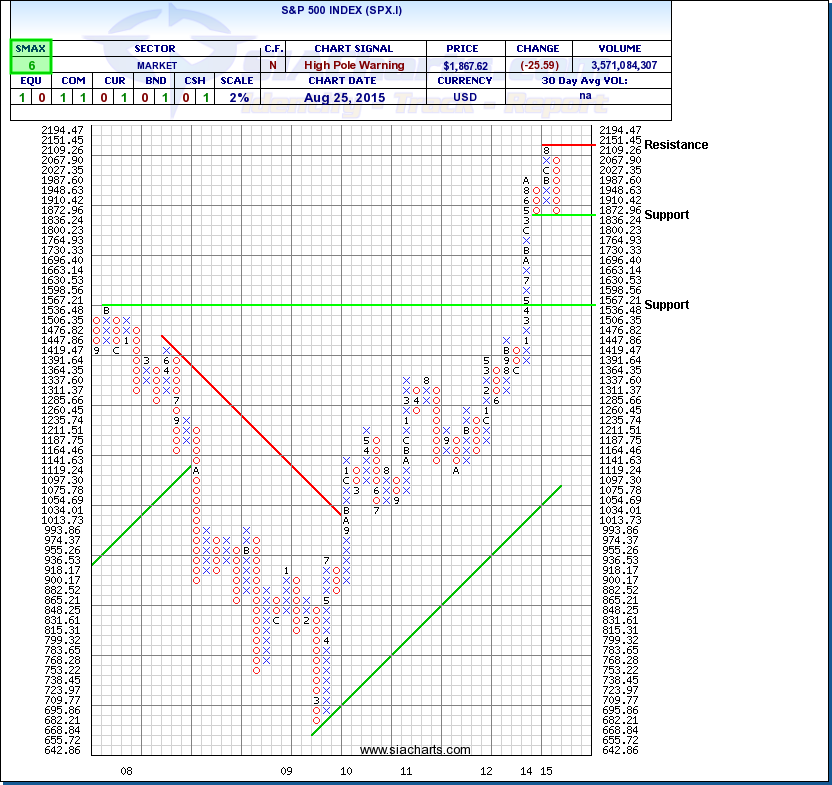
S&P 500 Index (SPX.I)
Since the Equity Action Call has moved into Neutral and we are in a hold pattern for new equity purchases, let's take a closer examination of what has happened recently with the US Equity asset class moving into second position within our Asset Class Rankings. Looking at the S&P 500 Index point and figure chart we can see that after the tremendous rally since early 2012, we are witnessing a rather large pullback. Currently in a column of O's, the index is sitting near significant support at the 1836 level. If this level holds and a test through resistance is successful at the July highs at 2151, then maybe we'll see changes in the overall Asset Class Rankings and the Equity Action Call allowing for new equity purchases.
However, a break through support at 1836 could open the door to a much further deterioration of this index which is why we remain cautious and follow our set rules for investing. Managing risk is an integral part of successful investing and these steadfast rules allow us to navigate through a wide range of market conditions.
Click on Image to Enlarge
SIACharts.com specifically represents that it does not give investment advice or advocate the purchase or sale of any security or investment. None of the information contained in this website or document constitutes an offer to sell or the solicitation of an offer to buy any security or other investment or an offer to provide investment services of any kind. Neither SIACharts.com (FundCharts Inc.) nor its third party content providers shall be liable for any errors, inaccuracies or delays in content, or for any actions taken in reliance thereon.