
Where will the S&P 500 go next? Let the market tell you.
by Adam Grimes
Given the action in US stocks this week, I thought this might be a good time to share a few thoughts about the market. I hope to be able to show you a way to think about the market that will cut through all of the fear, hype, exaggeration, and other “stuff” out there that makes the job of trading even harder than it is.
Be an intelligent consumer of financial media
First, let’s talk about news and psychology: There are a number of reasons for what has happened this week in the markets. There always are, and I would respectfully submit that it is probably a mistake to focus attention on those reasons. By the time you know about those reasons (or have read about them in the news), everyone knows; many people knew before you did, and all of that information is probably already in the price–it’s already baked into the cupcake, so to speak.
The news and hype around the reasons for the market’s movements often serve to exaggerate the swings of the individual trader/investor’s psychology. You must be aware of that. When you find yourself thinking “oh, no”, “what if….?” or thinking about extreme scenarios, take a step back and realize that the information you are immersed in is usually cast in a way to create those reactions. You rarely receive truly unbiased and pure information. I’m not saying ignore the news, but we must always strive to be intelligent consumers of financial news–and this means removing the emotional part.
Putting the market’s moves in perspective
Now, let’s talk about the market’s movements and I’ll show you a way to think about the future. Though the world is a complex and interconnected web, the S&P 500 is a very good proxy for the US market as it captures a significant cross-section of the market. Smaller caps may do some weird things, and the mega caps (like the DJIA) are not the best guide to the broad market for a number of reasons. No answer is perfect and we always do need to be aware of the connections (my “index universe” of domestic and global stock indexes covers about 25 that I watch intimately (i.e., constantly, intraday) and another 30 or so that I look at maybe twice a day), but the S&P 500 is a pretty good instrument. With that in mind, let’s take a look at some recent history. Apologies that the chart may be a bit small, but I needed to fit a good chunk of history on the screen:
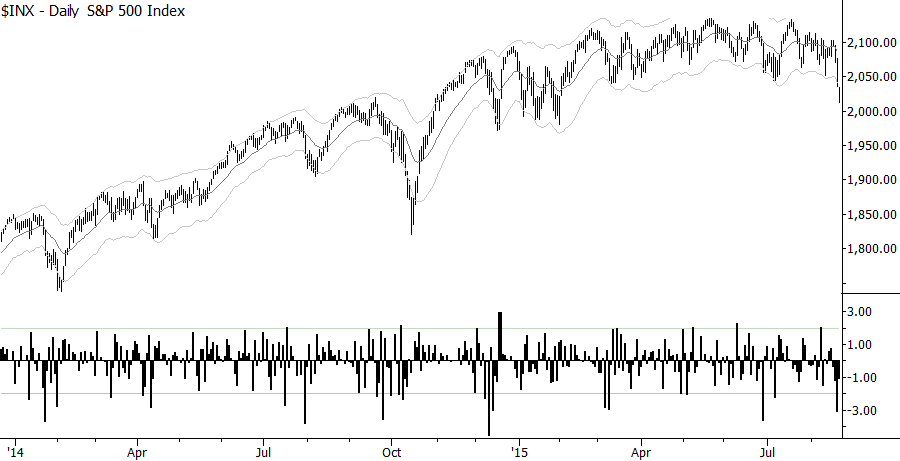
So, the first thing I would call your attention to is the set of bars at the bottom of the chart. These bars are what I have called SigmaSpikes, which are simply each day’s return, expressed as a standard deviation of the previous 20 trading days. This allows a quick look at volatility-adjusted returns, and is a good answer to the “was that a big move?” question. A few things stand out: we have roughly a dozen days each year that are bigger declines than -2.0 standard deviations. Some years less, some years more, but even in extreme years like 2000, or 2007-2009, not as many more as you’d expect. Looking at the chart above, you can see that there isn’t really anything unusual going on here–we haven’t had a lot more very weak days than usual.

Also, notice that the spikes do tend to cluster together. This tells us that once we have some large declines, we’re likely to have more volatility in the near future–certainly worth keeping this in mind over the next 3-4 weeks. This is how the market usually works, so don’t panic when we have a few more strong down days. Next, let’s look at the weekly chart for a longer perspective:
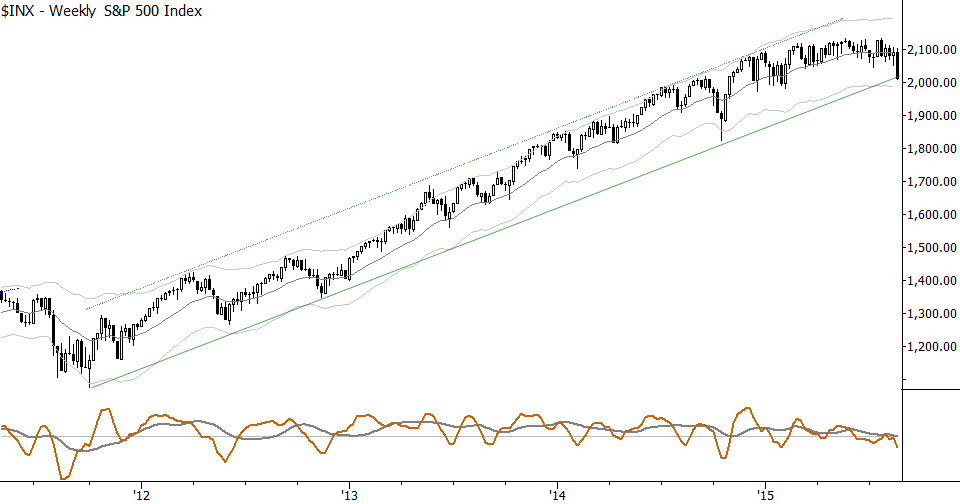
Technical traders and analysts are often accused of being myopic, but we don’t have to be. This is a trendline that I’ve had in place and have been watching in my published research since late 2012. We touched this trendline in October of 2014, and have just now come down to the trendline again.
Trendlines deserve some attention, but they don’t, in my experience, work like you might think. There are very few points where we can say “the trend is over because the trendline is broken”, so do be careful of that type of “analysis”. (And we’re seeing a lot of it in recent weeks.) More often, trendlines are broken, perhaps suckering in naive trendline traders, and then the moves reverse. I’ll also throw out that there’s not a shred of evidence that suggests any ratios (including the Fibonaccis), moving averages, trend indicators, or other tools have a lot of predictive value. So what does matter?
What happens next is what’s important
Here’s a good way to think about it: The market usually moves in alternating waves of with trend strength (or weakness, for a downtrend), interspersed with pullbacks against that trend. (This is why trading pullbacks can be such a lucrative strategy.) The October 2014 selloff is a good model, and that’s the only time in recent years I started looking for swing shorts. Take a look at a chart of what might have been:
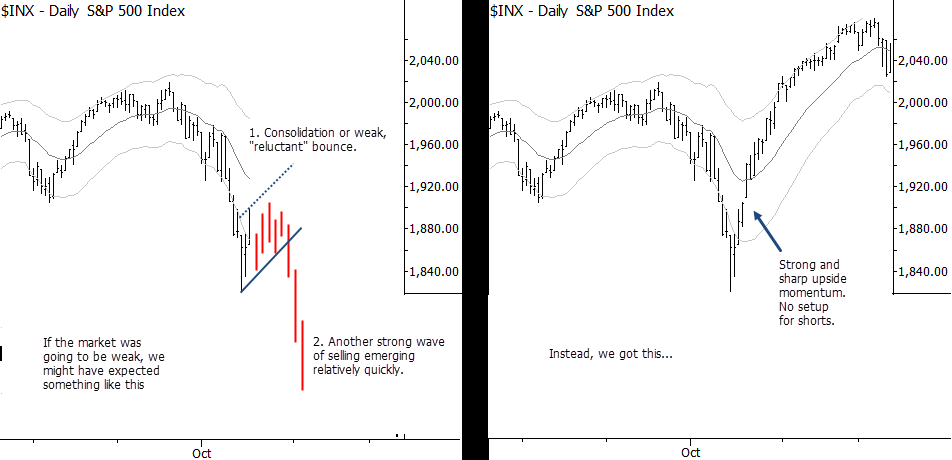
In October 2014, the selloff in stocks was strong enough (i.e., generated enough downside momentum) that we might reasonably have looked for another leg down. If that scenario was in play, what we “should have” seen was a fairly slow bounce, setting up some kind of flag/pullback, that would pretty quickly break to new lows. If that had happened, there was a possibility that we’d see continued legs of selling and the eventual breakdown of trends on higher timeframes. This is a good roadmap for how lower timeframe trends can have an impact on higher timeframes.
Instead, what happened? The market turned around, rocketed higher, and we knew, literally within the space a few days, that this wasn’t an environment in which we were likely to find good shorts. Instead of the slow bounce, we got a hard bounce and the market quickly went to new highs. Following the decline, that type of bounce was unusual, but it was a clear message from the market.
I think this type of action is going to be our best guide here. We’ve had a lot of selling pressure this week, and I’m writing this intraday Friday, so we might have even more by the end of the week. (Likely, since people do seem to square up positions ahead of the weekend.) However, there is no pattern or trendline or any sentiment indicator that is going to paint a reliable guide for the way forward. Our best insight will come from the market itself over the next few weeks. To understand that message most clearly, we must try to see things for what they really are and remove the emotional component from our analysis.
One last thought: the market tends to surprise everyone. That’s just a little bit of “hard knocks” type of experience that we might factor into our subjective analysis. Let’s see what the next few weeks bring.
About Adam Grimes
Adam Grimes has two decades of experience in the industry as a trader, analyst and system developer. Growing up in an agricultural community in America’s Midwest, Adams first trading experiences were in agricultural commodities and futures. He then moved to currency futures, trading during the Asian Financial Crisis, and to stock index futures and individual stocks. His trading experience covers all major asset classes–futures, currencies, stocks, options, and other derivatives, and the full range of timeframes from very short term scalping to constructing portfolios for multi-year holding periods.
Adam holds an MBA from The Ohio State University, and is currently Chief Investment Officer of Waverly Advisors, LLC, a boutique research and advisory firm for which he writes daily market commentary and trade notes. Prior to joining Waverly Advisors, Adam held the positions of VP of Quantitative System Development at Level Partners, LLC, Senior Analyst and Trader at MBF Asset Management on the New York Mercantile Exchange, and Chief Technical Strategist at SMB Capital. Adam is the author of The Art & Science of Technical Analysis: Market Structure, Price Action & Trading Strategies, published in 2012 by John Wiley & Sons. Adam is also a contributing author for several publications on quantitative finance and related topics, and is much in demand as a speaker and lecturer on the topics of technical trading, risk management, and system development.
Adam is also an accomplished musician, having worked as a professional composer, and classical keyboard artist specializing in historically-informed performance practices. He is also a classically-trained French chef, having served a formal apprenticeship with chef Richard Blondin, a discipline of Paul Bocuse.